Debugging the Project - mips-open-ide/Releases GitHub Wiki
Before you debug, it is recommended that you select the MIPS entry in the Project Explorer, as shown in Figure 24, before opening the Debug Configuration Dialog. Doing so will enable eclipse to automatically fill out the necessary debug configuration information.
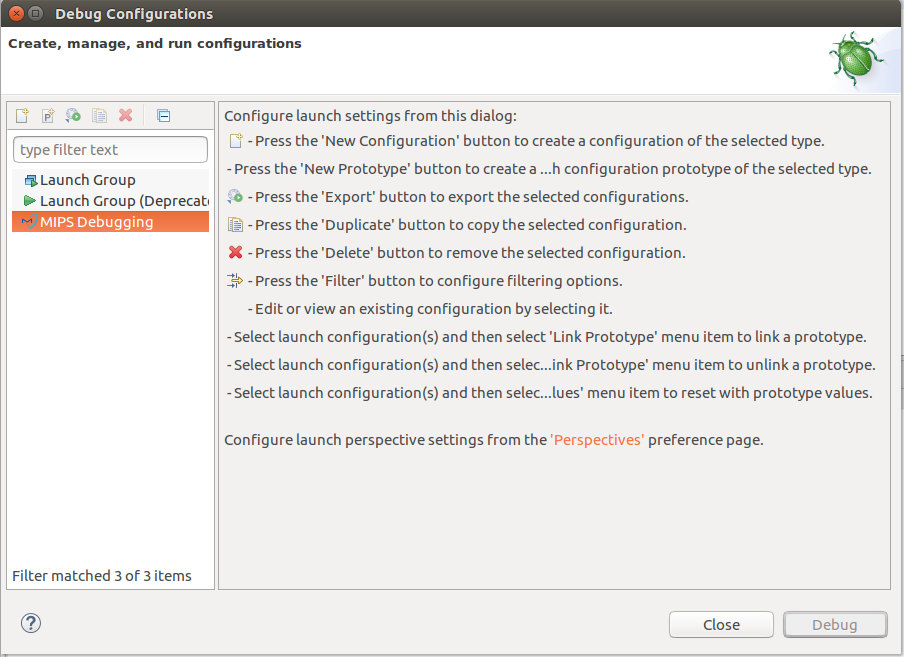
Figure 24 - Debug Configuration Dialog
Now you can debug the “MIPS” application by selecting Debug->Debug Configurations, or by clicking on the tiny down arrow next to the cockroach and select “Debug Configurations” as shown in Figure 25.
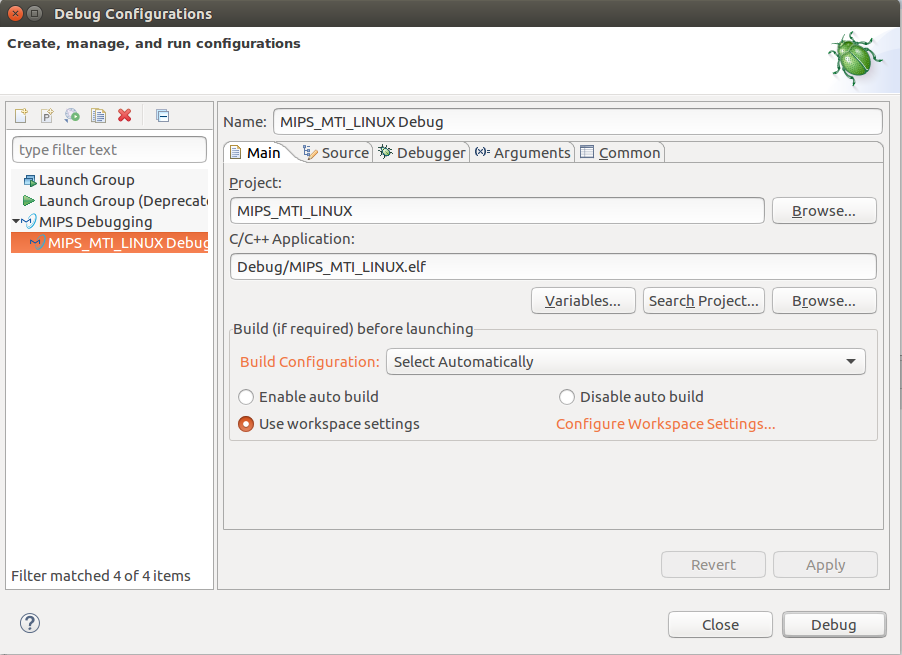
Figure 25 - Opening Debug Configuration Dialog
From the Debug Configuration Dialog:
• Select MIPS Config in the launch list
• Double click on the plus icon in the toolbar to create a new debug configuration for the MIPS project
You should see the Main Debug Tab shown in Figure 26:

Figure 26 - Main Debug Tab
At this point, MIPS Open IDE should offer the Debug perspective and you shall accept, as shown in Figure 27

Figure 27 - Switching to Debug Perspective
From the Debug perspective shown in Figure 28, you can press “Resume” button to resume execution, or “Halt” to suspend execution. Notice that the debug view should annotate your current program location within the execution flow. In addition, breakpoints, register, and memory viewing are all available with just a few mouse clicks!
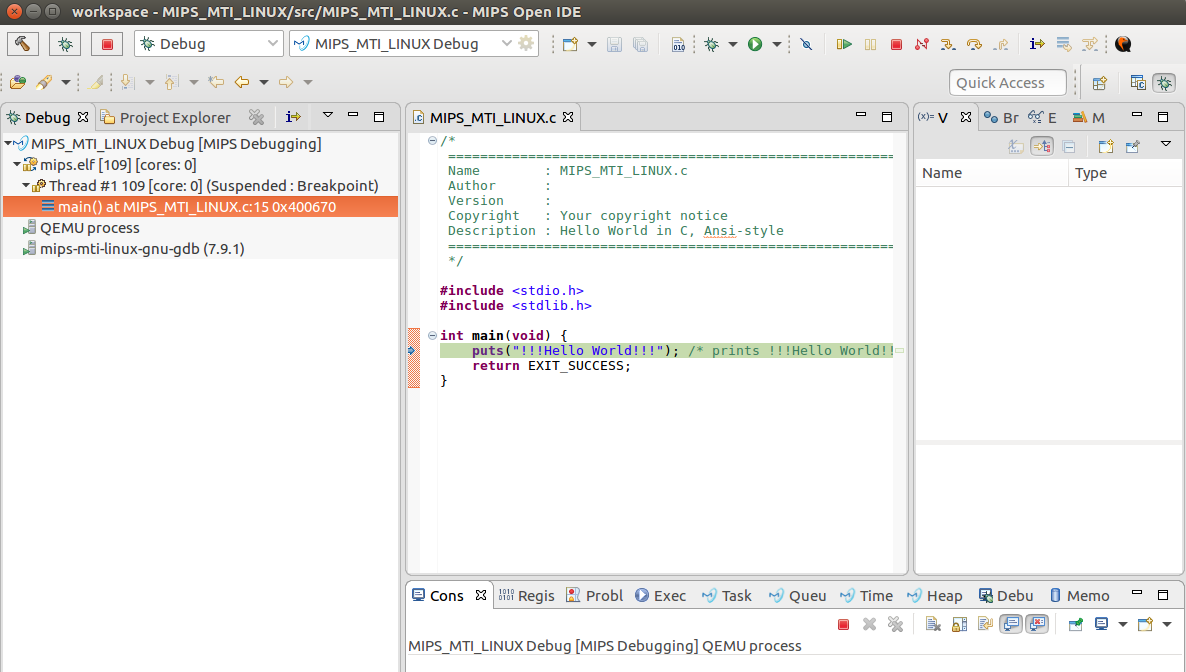
Figure 28 - Debugging of Application in Debug Perspective
The project building and execution facilities of MIPS Open IDE are discussed in greater detail in subsequent chapters of this guide. Hopefully, this chapter illustrates just how easy it is to get a project up and running with MIPS Open IDE!