Surface Plotting - metxchris/TRANSVIZ GitHub Wiki
TRANSVIZ has also been designed to plot the two-dimensional Time-Position surface of a single variable. This mode is enabled by selecting the Surface Plot Mode within the Edit menu of the upper menu-bar:
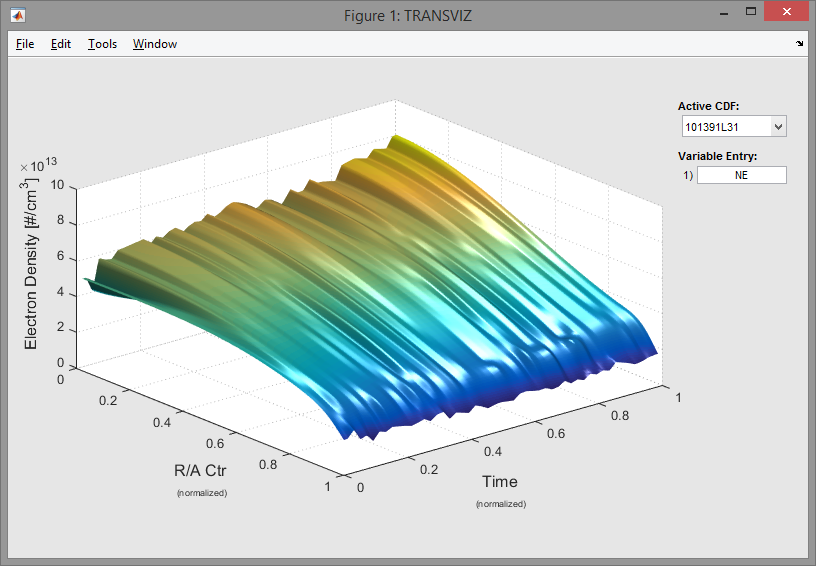
Only the first variable entry-box is displayed using this mode, but the others will reappear when switching back to the Line plotting mode.
By default, the 3D rotation tool is auto-selected when viewing surface plots; either click and drag to rotate the plot, or right-click to view a popup of additional rotation features. Also, additional CDF data corresponding to the plotted surface variable can be found via a tool-tip by hovering the mouse over the variable entry box.
Menu Options:
Here is a basic description of each option within the TRANSVIZ menu-bar with respect to surface plotting. Note that switching the surface style will alter the amount of data that is exported, in addition to altering the appearance of the surface itself.
- File
- Open CDF - Open another CDF file.
- Export Figure - Creates an .eps of the currently displayed surface.
- Export Data - Exports a spreadsheet of xyz-data corresponding to the surface current plot.
- Edit
- Plot Mode - Switches between Line Plotting and [Surface Plotting](https://github.com/metxchris/TRANSVIZ/wiki/Surface -Plotting).
- Renderer - OpenGL should almost always work here. As a warning, Painters mode is extremely slow for surface plotting.
- Surface Grid Lines - Enable/Disable grid lines; the R2014b version has subtle light-gray grid lines, where the R2014a unfortunately has obtrusive black grid lines.
- Surface Box - Enable/Disable the surface box.
- Surface Style - Changes the appearance and amount of data displayed for the chosen surface. The default option 'Surface Texture' will display all loaded data points, where as the other two options 'Surface Grid' and 'Mesh Grid' will display a courser grid of data. These latter two options will run faster on slower machines, and also export much less data than the default option.
- Color Map - Sets the surface color map.
- Tools
- Zoom In - Enables plot zooming. Right click to see an popup menu for additional zooming options. This tool must be deselected to disable it.
- Pan - Enables plot panning. Right click to see a popup menu for additional panning options. This tool must be deselected to disable it.
- Window
- Variable List - Loads the Variable List window.
- Pointer List - Loads the Pointer List window.
- Console - Loads the Console window.