Line Plotting - metxchris/TRANSVIZ GitHub Wiki
The main functionality of TRANSVIZ is the line plotting feature, as shown using the Time Slider Mode below:
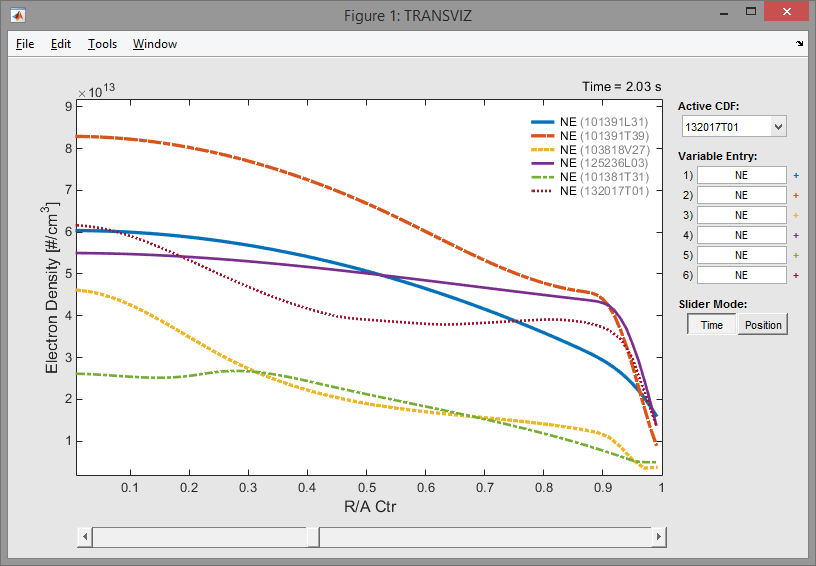
Using the Time mode, variables will be plotted as a function of position at a specific instance in time. The slider below the plot will adjust this time-value that each line corresponds to, with the global time displayed to the top-right of the plot. Since variables from different Run Id's do not typically correspond to the same set of time values, an interpolation step has been used to get around this issue; see the Variable Interpolation section for more details on this process.
Alternatively, using the Slider Mode toggle located at the right-hand side of the TRANSVIZ window, we can also switch the slider to Position mode. Position mode will instead plot variables as a function of time, located at one specific position within the plasma. An interpolation step is again used here in the case that different Run Id's use different position step-sizes. A sample line plot in position mode corresponding to the above image is shown below:
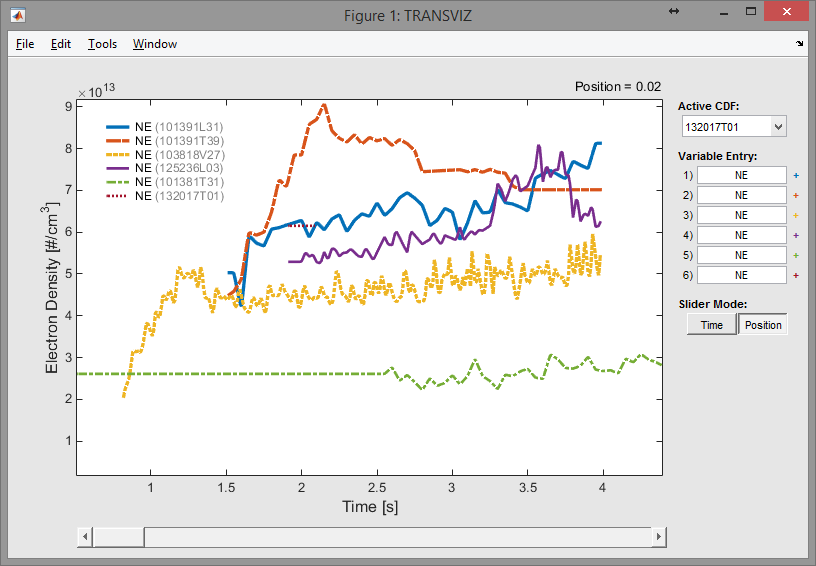
Note that the legend can be moved by clicking and dragging it, in the case that better visibility is needed. This image also shows that the output from each of the six selected Run Id's do not start and stop at the same time values. When using the Time slider mode, lines will disappear if their corresponding data is not defined in the specified time domain.
Additional Features:
The format and appearance of each line may be edited using the popup line UI menu. You can access this menu for each plotted line by either right-clicking on one of the lines itself, or by clicking on the corresponding plus symbol '+' that appears next to the entry box corresponding to the desired line. The color of the plus symbol will change to match newly chosen line colors.
Also, additional CDF data corresponding to each plotted variable can be found via a tool-tip by hovering your mouse over the desired entry box.
Menu Options:
Here is a basic description of each option within the TRANSVIZ menu-bar with respect to line plotting.
- File
- Load CDF - Load another CDF file.
- Export Figure - Creates an .eps of the currently displayed figure.
- Export Data - Exports a spreadsheet of the data corresponding to the current plot.
- Edit
- Plot Mode - Switches between Line Plotting and [Surface Plotting](https://github.com/metxchris/TRANSVIZ/wiki/Surface -Plotting).
- Renderer - Switches between Painters and OpenGL (shouldn't be necessary if using version R2014b). The OpenGL mode is preferred for all cases, but Painters might be needed if the plot crashes due to bugs in the older R2014a version.
- Axes Box - Enable/Disable the axes box; this option has a greater effect on exported figures.
- Grid Lines - Enable/Disable grid lines; the R2014b version has subtle light-gray grid lines, where the R2014a unfortunately has obtrusive black grid lines.
- Legend Location - Changes the default location of the legend. The legend can also be temporarily moved by click and dragging it. The location always reverts back to the preset location every time a new variable is loaded.
- Line Transparency - (Version R2014b only) Sets the alpha transparency of plotted lines; currently does not affect marker plots though.
- Tools
- Zoom In - Enables plot zooming. Right click to see an popup menu for additional zooming options. This tool must be deselected to disable it.
- Pan - Enables plot panning. Right click to see a popup menu for additional panning options. This tool must be deselected to disable it.
- Window
- Variable List - Loads the Variable List window.
- Pointer List - Loads the Pointer List window.
- Console - Loads the Console window.