Scatter and Bubble Charts - methnen/m-chart GitHub Wiki
Available in M Chart v.1.6+
Scatter and Bubble charts are handled a bit differently than other chart types in M Chart because of the data involved.
To deal with these differences when you select either some additional interface elements will appear allowing you to handle multiple sheets of data in a single chart:
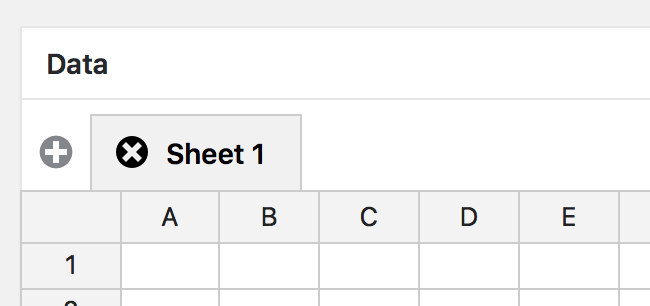
This enables multiple sets of data in each chart.
Scatter chart data should be arranged in two columns or rows:
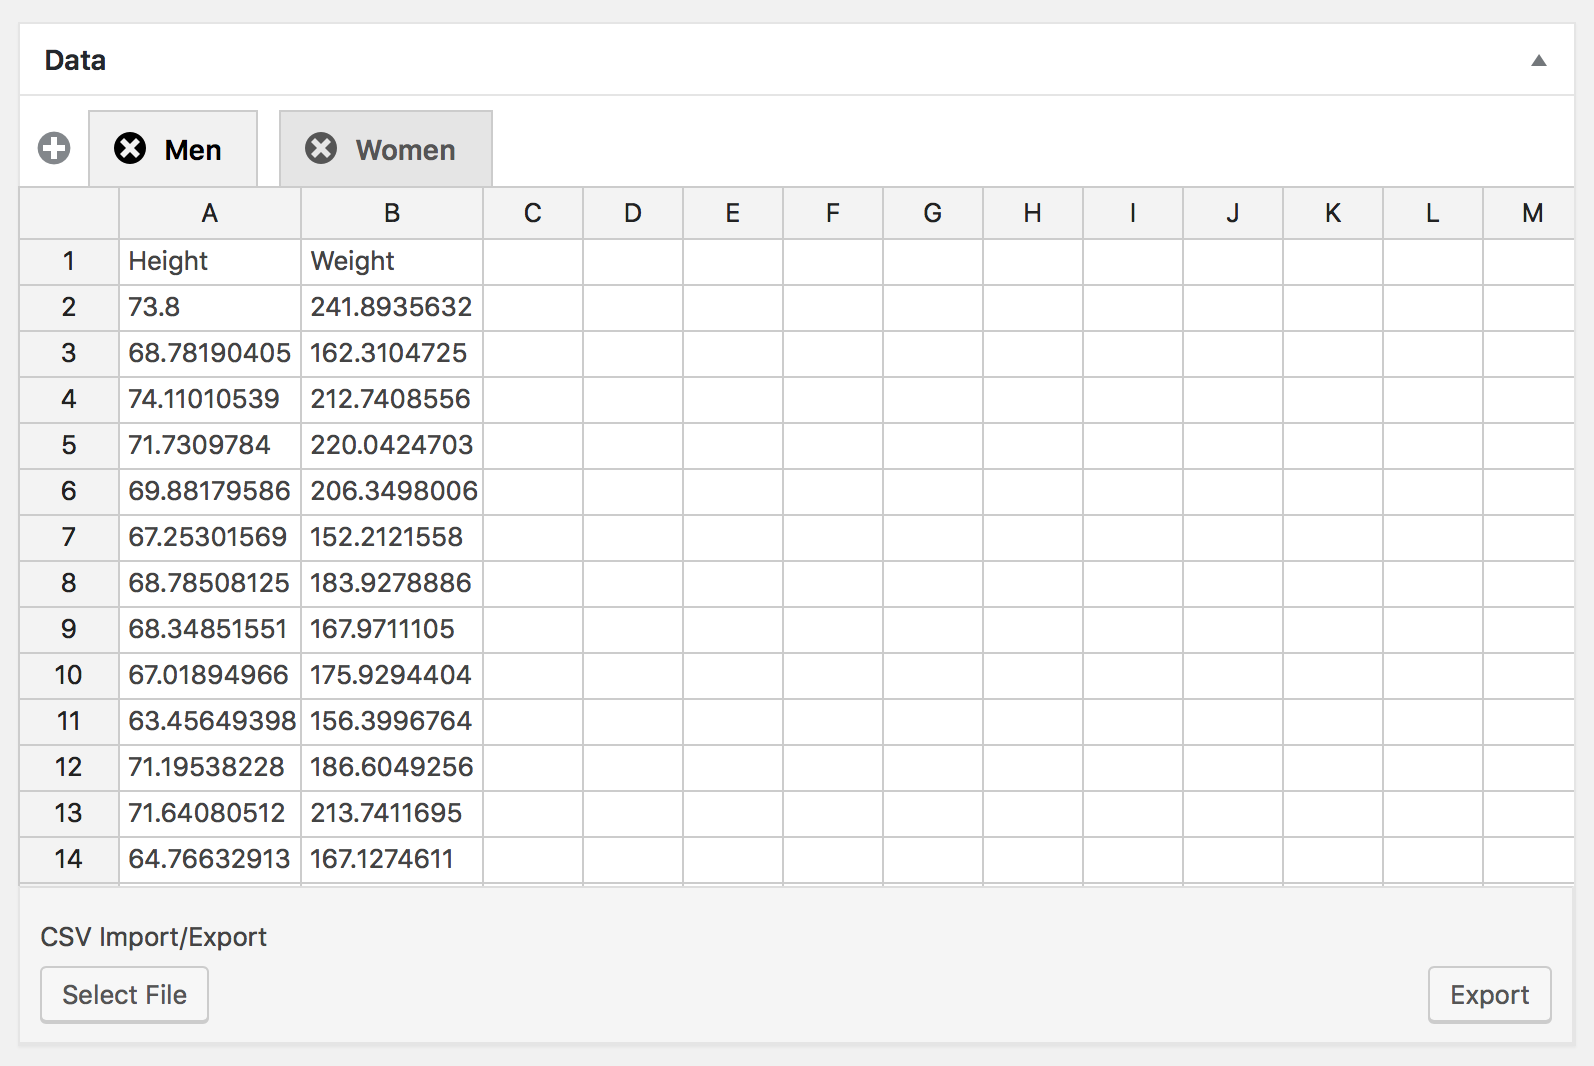
You'll note in the above case that I've actually got two matching types of data split into groupings of Men and Women which illustrates how the multiple sheet controls can be useful.
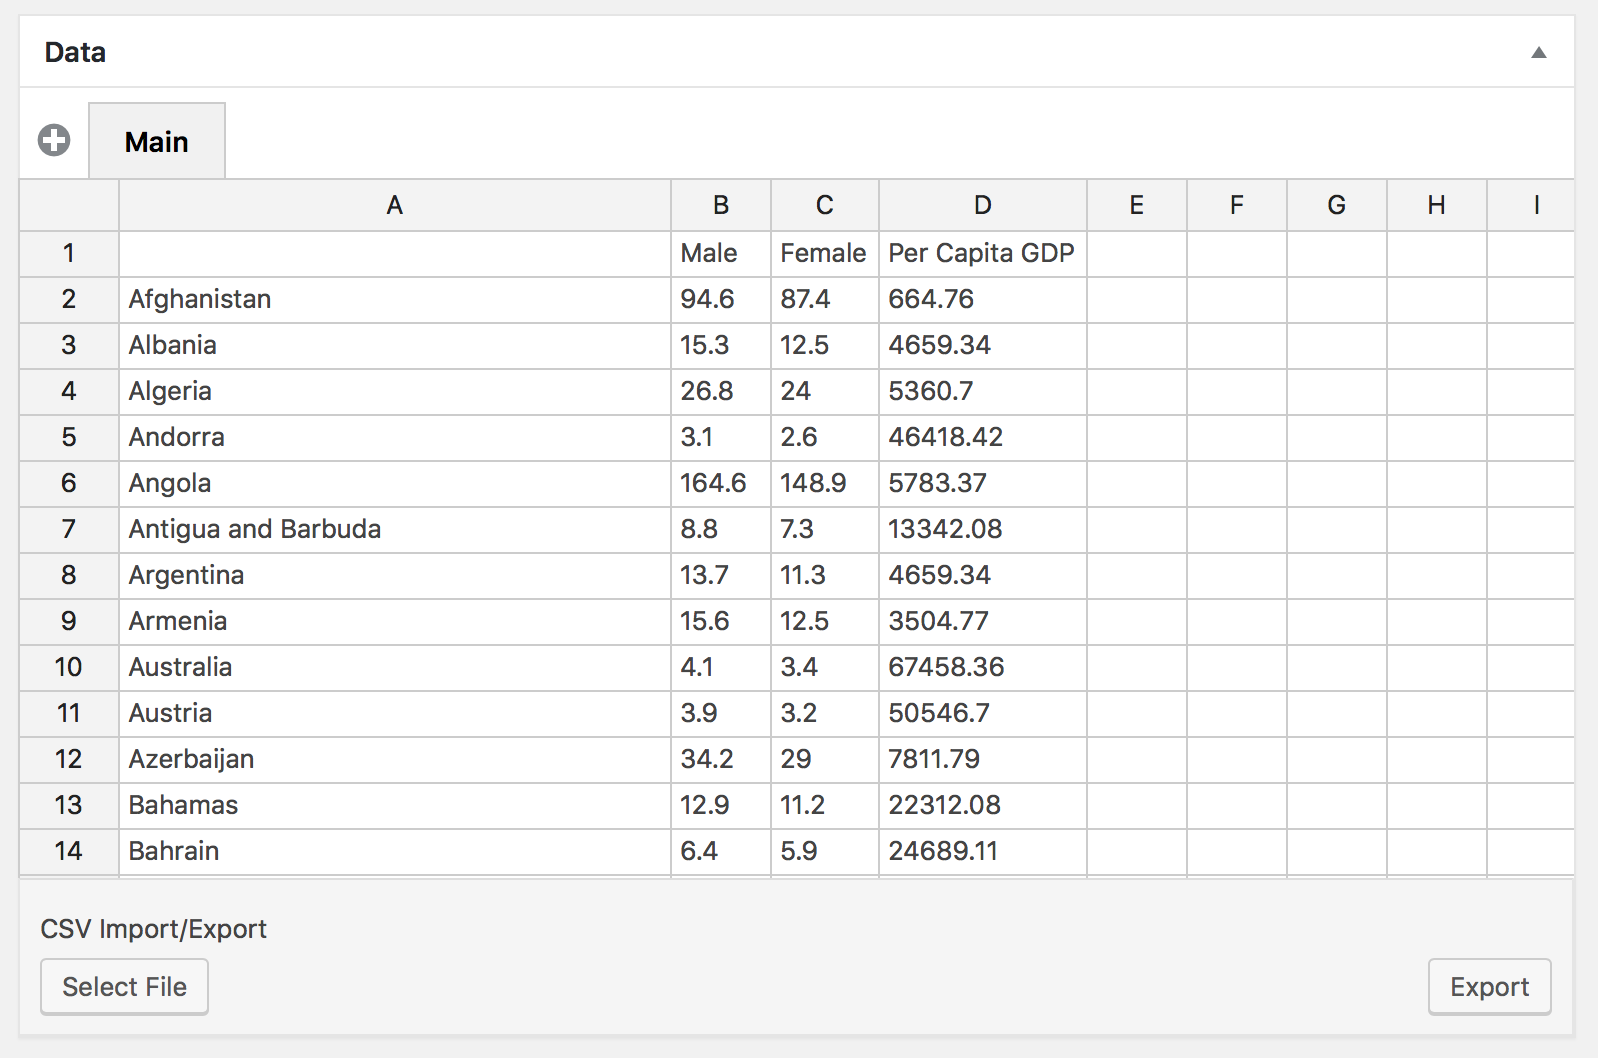
Bubble chart data should be arranged in three columns or rows with a label column or row of some type:
Example Charts
If you'd like to play with some example charts you can download either the Chart.js Example Files Export or Highcharts Example Files Export and import them using the WordPress Importer plugin.