Dashboard - magicbug/Cloudlog GitHub Wiki
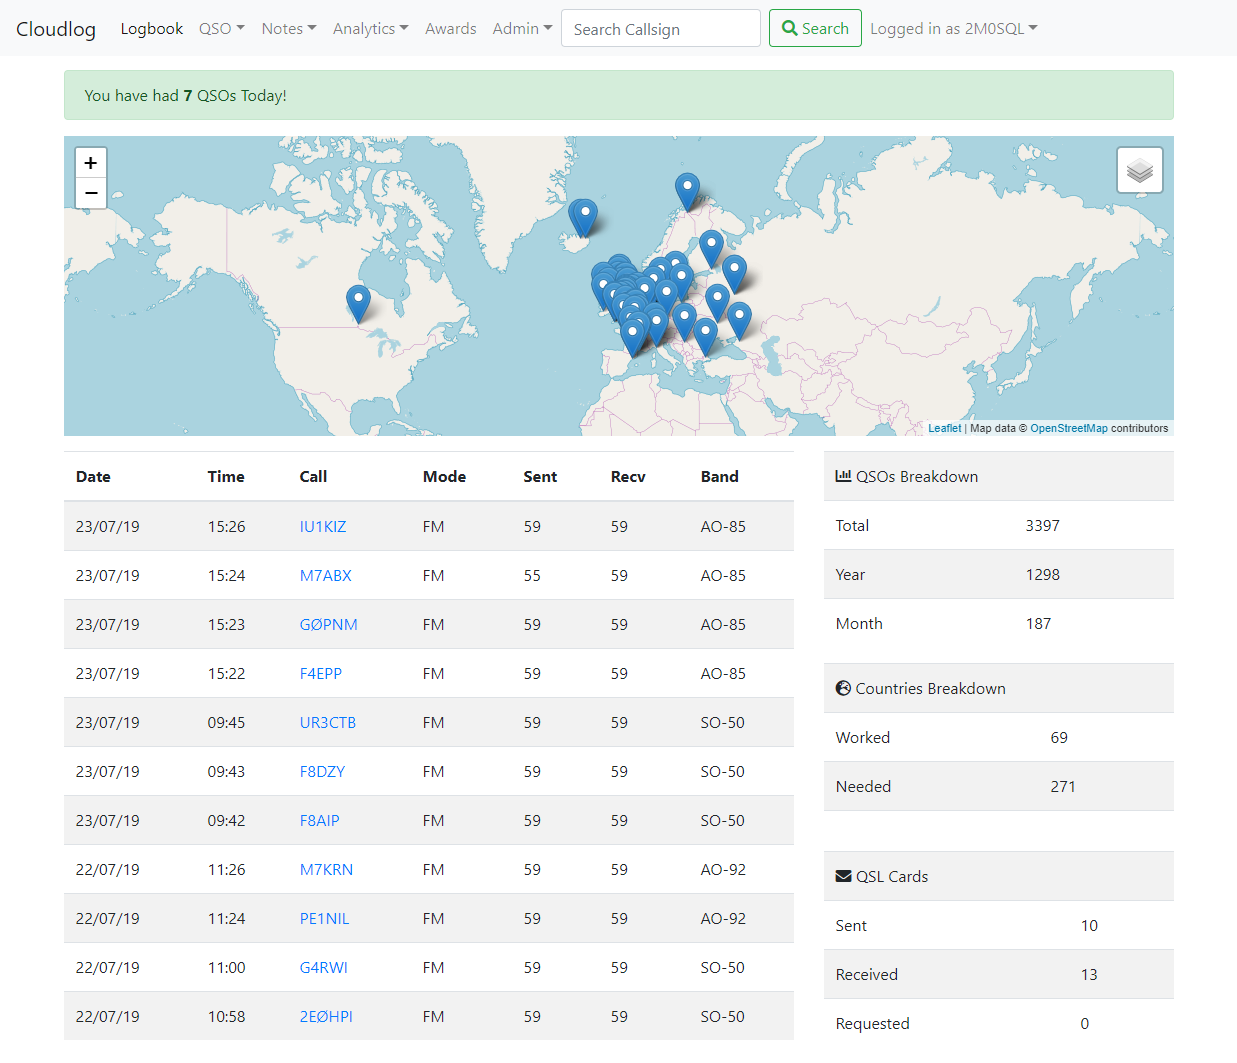
The Dashboard is the page after login, as well as the standard top bar menu and map it gives a list of the most recently made QSOs in the logbook, and some high level statistics on QSOs, Countries worked, and QSL cards. The map only shows contacts made in the last 7 days, on the logbook page it shows the contacts listed on that page.
Menu options
Logbook takes you to a page that is the Dashboard minus the QSO, Countries and QSL references.
QSO dropdown has the following:
- Live QSO - uses data from your radio to populate freq, and uses a real time clock.
- Post QSO - all information is entered manually.
Notes is an area for entering information that you use frequently such as frequency references and skeds. These notes can't be accessed whilst entering details in the QSO section.
Analytics dropdown has the following:
- Statistics provides info on QSO per year, mode and band, plus a list of satellites used.
- Gridsquares can be viewed by band or satellites, the map starts at the high level and zooms through the sub and extended squares.
- Distances worked are selected by band or satellites (not individual sats) and are displayed in a graph of distance against number of QSOs with callsigns listed at each range. Number of contacts and the detail of the furthest contact are also provided.
- Days with QSOs are broken down by year and number of days then plotted in a graph.
- DXCC Timeline shows DXCC contacts by date and prefix with a link to the details of the contact.
Awards breaks down QSO into DXCC, VUCC, WAS, CQ, IOTA, WAB, SOTA, and DOK with detailed listings available under each award section.
Admin dropdown has the following:
- Accounts enables the owner to add more than one user to the logbook which is very useful for clubs and competition stations.
- API
- Station Profiles
- Radio Interface
- ADIF Import/Export
- LoTW Import/Export
- eQSL Import/Export
- Print Requested QSLs
- Backup
- Update Country Files