PowerBI - lydia-wu/cadence GitHub Wiki
Yukihiro, Hayley; 2021-09-07 Tuesday
PowerBI Initial Deep Dive
Main Download Informational Link:
https://powerbi.microsoft.com/en-us/ https://powerbi.microsoft.com/en-us/why-power-bi/
Microsoft Documentation Links:
https://docs.microsoft.com/en-us/power-bi/fundamentals/power-bi-overview
https://docs.microsoft.com/en-us/power-bi/fundamentals/power-bi-overview
Power BI Trainings:
https://docs.microsoft.com/en-us/learn/modules/introduction-power-bi/1-introduction
https://www.tutorialspoint.com/power_bi/power_bi_introduction.htm
https://data-flair.training/blogs/power-bi-tutorial/
- Works alongside: Azure, Excel
What is Power BI?
- Collection of software services, apps, and connectors that work together to turn your unrelated sources of data into coherent, visually immersive, and interactive insights
- Power BI is a Data Visualization and Business Intelligence tool that converts data from different data sources to interactive dashboards and BI reports
- Provides multiple software, connector, and services - Power BI desktop, Power BI service based on Saas, and mobile Power BI apps available for different platforms
Parts of Power BI
- Power BI consists of:
- A Windows desktop application called Power BI Desktop
- Power BI desktop app is used to create reports
- An online SaaS (Software as a Service) service called the Power BI service
- Power BI Services (Software as a Service - SaaS) is used to publish the reports
- Power BI mobile apps for Windows, iOS, and Android devices
- Power BI mobile app is used to view the reports and dashboards
- Power BI Report Builder, for creating paginated reports to share in the Power BI service.
- Power BI Report Server, an on-premises report server where you can publish your Power BI reports, after creating them in Power BI Desktop.
- A Windows desktop application called Power BI Desktop
- Different platforms to help create and share data insights
Power BI Architecture
- Power BI Desktop − This is used to create reports and data visualizations on the dataset.
- Power BI Gateway − You can use Power BI on-premises gateway to keep your data fresh by connecting to your on-premises data sources without the need to move the data. It allows you to query large datasets and benefit from the existing investments.
- Power BI Mobile Apps − Using Power BI mobile apps, you can stay connected to their data from anywhere. Power BI apps are available for Windows, iOS, and Android platform.
- Power BI Service − This is a cloud service and is used to publish Power BI reports and data visualizations.

1. Data Integration
- Import data from different kinds of data sources in different formats.
- Bring data together (extracted) from different data sources and converts it into a standard format.
- Stored in a common storage area known as the staging area.
2. Data Processing
- Raw data requires some processing
- Several processing or cleansing operations transform the raw data such as removing redundant values, etc.
- Apply relevant business rules on the processed data that transforms it according to our business needs.
- Transformed data is loaded into the data warehouses. This
- Completes a full process of ETL (extract, transform and load)
3. Data Presentation
- Processed data moves from the warehouse and goes into the Power BI platforms like Power BI Desktop to create reports, dashboards, and scorecards.
Power BI Supported Data Services
- supports large range of data sources
- allows you to connect to different flat files, SQL database, and Azure cloud or even web platforms such as Facebook, Google Analytics, and Salesforce objects
- includes ODBC connection to connect to other ODBC data sources
- Open Database Connectivity (ODBC) is a protocol that you can use to connect a Microsoft Access database to an external data source such as Microsoft SQL Server
- Available data sources in Power BI:
- File: Excel, Text/CSV, XML, PDF, JSON, Folder, SharePoint.
- Database: SQL Server database, Access database, Oracle database, SAP HANA database, IBM, MySQL, Teradata, Impala, Amazon Redshift, Google BigQuery, etc.
- Power BI: Power BI datasets and Power BI dataflows.
- Azure: Azure SQL, Azure SQL Data Warehouse, Azure Analysis Services, Azure Data Lake, Azure Cosmos DB, etc.
- Online Services: Salesforce, Azure DevOps, Google Analytics, Adobe Analytics, Dynamics 365, Facebook, GitHub, etc.
- Others: Python script, R script, Web, Spark, Hadoop File (HDFS), ODBC, OLE DB, Active Directory, etc.
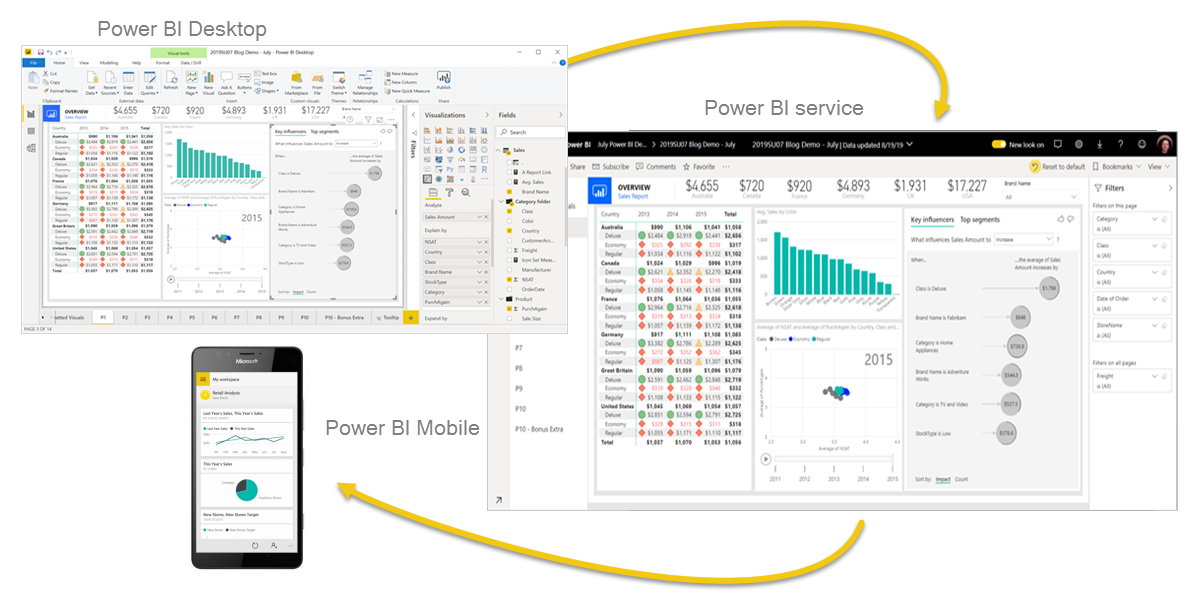
Work Flow in Power BI

- Connecting to data sources in Power BI Desktop and building a report
- Publish that report from Power BI Desktop to the Power BI service
- Share it so business users in the Power BI service and on mobile devices can view and interact with the report
How Power BI can integrate into Cadence
- Real-time analysis in Power BI can be done by establishing direct connections to the data sources.
- keeps data updated to the latest second by data refreshing
- Quickly search for important insights and datasets within your data by using the Quick Insights option.
- Establish a live or non-live connection to on-premises data sources like SQL Server, and use a secure channel to access data through data gateways
- makes Power BI enterprise-ready as on-premises connections make data transfer secure and the technology scalable and reliable
- Use Power BI APIs to push data into datasets or to embed dashboards and reports into your own custom applications
- Power BI API: https://docs.microsoft.com/en-us/power-bi/developer/automation/overview-of-power-bi-rest-api
- Using Power BI REST API, you can create apps that integrate with Power BI reports, dashboards, and tiles
- possible to perform management tasks on Power BI objects like reports, datasets, and workspaces.
- As developers, you can embed Power BI content in applications, develop Power BI visuals, and automate Power BI processes
- GitHub Repository Developer Sample: https://github.com/Microsoft/PowerBI-Developer-Samples
- Power BI Developer Documentation: https://docs.microsoft.com/en-us/power-bi/developer/