Report - lucadellasantina/ObjectFinder GitHub Wiki
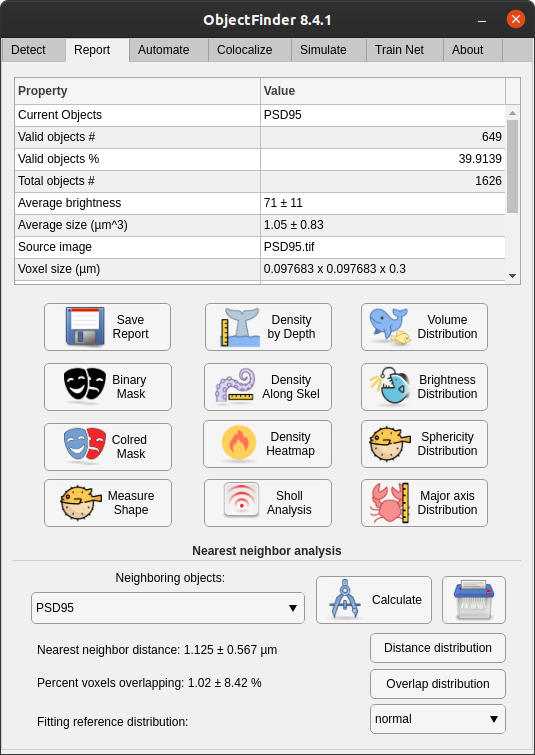
Using the "Report" tab you can obtain and plot statistics about found objects Select an objects set from the top-left drop-down box to display their properties.
Save report: Saves general statistics of the objects displayed in the table
Binary Mask: Generates a binary mask of the volume where voxels belonging to detected objects are marked all in white.
Colored Mask: Generates a binary mask of the volume where voxels belonging to detected objects are marked with different colors, each object has different color than its neighbors.
Measure Shape: Perform shape measurements for each object in the current set, overrides any previously made shape measurements.
Plot Density
Density By Depth: plots density of objects as a function of Z depth in the volume Density Along Skel: plots linear density of objects along the path of a skeleton Density Heatmap: plots linear density of objets in the form of a 2D heatmap Sholl Analysis: Computes and plots the Sholl analysis of current skeleton
Plot Distribution
Volume distribution: plots the distribution of objects volume
Brightness distribution: plots the distribution of objects' brightness values
Sphericity distribution: plots the distribution of objects' oblongness, ranging from 1 (perfect sphere) to 0 (line). Oblongness is calculated comparing the lengths of the three major axes.
Major axis distribution: plots the distribution length of the objects' major axis obtained by fitting an ellipsoid to each object
For all distributions, values are fitted against the standard distribution specified in the drop-down box.
All values plotted are also saved inside the "Results" folder as excel spreadsheets.