Quick start - lsgro/quantcomponents GitHub Wiki
Install
Open Help -> Install New Software... and install feature QuantComponents base modules from the update site:
https://sourceforge.net/projects/quantcomponents/files/eclipse-4.x-update-site
For IB users: look [here](Eclipse feature installation)
Restart Eclipse
Shutdown and restart Eclipse (do not use File -> Restart, since it does not reload the configuration files) and choose the Window -> Open Perpective -> Other... -> Algo Trading perspective.
Enable decorators
Enter Eclipse preferences, and enable Market Data Auto Update and Trading Agent Executing in Window -> General -> Appearance -> Label Decoration.
Market Data Managers view
If everything went well, you should be able to see the Market Data Managers view in the top-left corner, populated with a MarketDataManager object.

If the view is empty, this means that the IMarketDataManager service is not active. Check out the Market Data Managers section in the troubleshooting page.
Create a new time series
- Right-click on the MarketDataManager, and choose Add Stock Database....
- Follow the wizard until a new time series is created. Be aware that this functionality uses the IB API, therefore pay attention to the confirm message from the IB client.
If you want the time series to be updating in real-time, check the Realtime Update option in the wizard. Otherwise you can right-click on the time series icon and use: Start auto-update.
To open a chart for the time series, double-click on it, or right-click and choose Open view.
Time series chart
The time series chart is configurable by right-clicking on it, and choosing the Setup menu item.
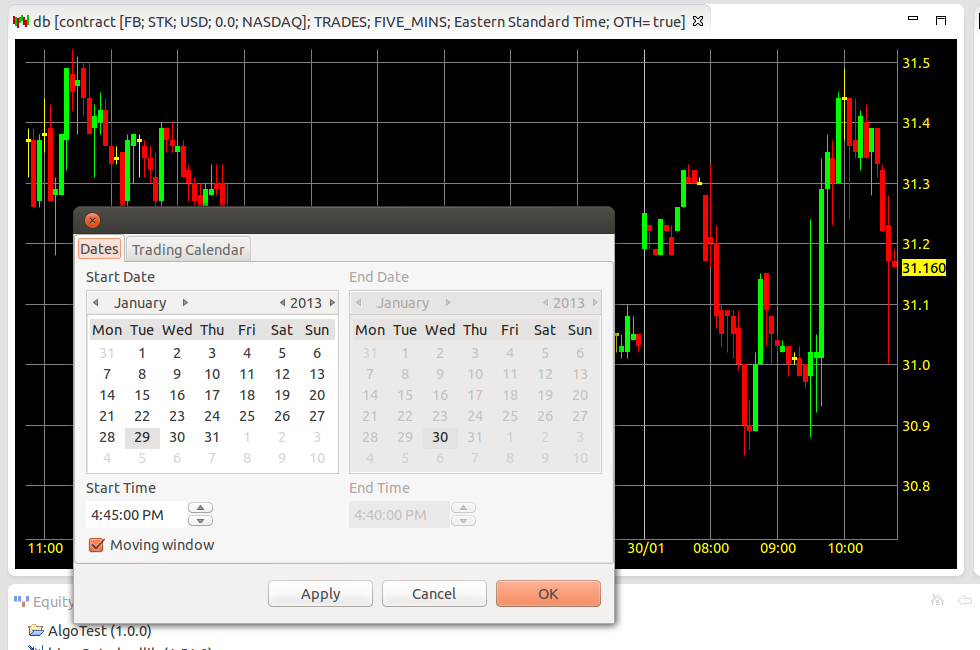
Once launched, the setup opens a dialog with two tabs:
- The Dates tab lets you change the time window to display, activating the download of historical data if needed. Unchecking the Moving window checkbox freezes the chart on a date interval.
- The Trading Calendar tab lets you change the trading calendar to use for displaying the time series. More information about trading calendars is [here](Trading calendars).
Time series database
The time series are stored by default in a Derby file-based embedded database
(service: com.quantcomponents.marketdata.IStockDatabaseContainer) that is created in a folder named
stockDatabase in the working directory of Eclipse.
To purge the database, simply delete the folder. It will be re-created empty upon startup of the application.
Trading Managers view
There should be also a Trading Managers view in the bottom-left
corner, populated with a TraingManager object, with a robot-shaped child.
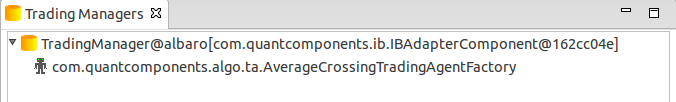
In case the view is empty, check the Trading Managers section in the troubleshooting page.
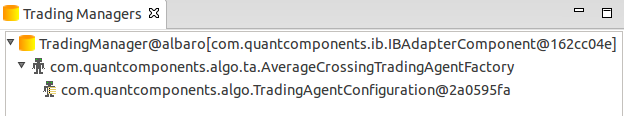
This view is where the trading strategies can be configured, tested and run. The configuration of a trading strategy is a two step process:
- Create an strategy configuration: right-click the robot-shaped icon, and choose
Create agent configuration.... If the agent factory (service: com.quantcomponents.algo.ITradingAgentFactory) corresponding to this icon needs some configuration
parameters, a dialog will open to enter values for them. It is possible to load them from a
properties file, if available. A configuration icon,
depicted ad a robot holding a paper sheet, will appear.
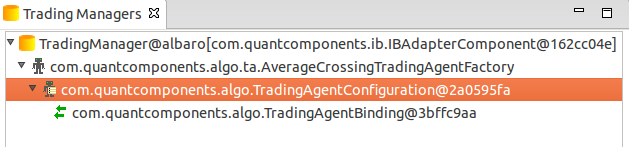
- Once created a configuration, it can be created a binding for it.
An strategy can have several time series as input.
When right-clicking on the agent configuration, choose Bind inputs... from the
contextual menu.
A dialog will appear, showing, for each input series, the input name on the left side, and a list of available input series on the right. The strategy pre-loaded in the framework needs only one input: stock. Once selected the inputs, a binding icon will appear below the configuration.
Several configurations can be created for an agent factory (strategy), and several bindings can be
created for each configuration.
The binding represents the strategy completely configured and ready to run.
Right-click on it and choose Start backtest to activate a run of the strategy on the current
snapshot of the bound time series.
A backtest is displayed as a blue icon below the agent binding.
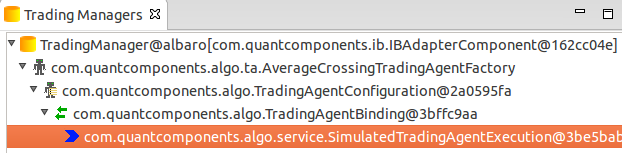
Selecting it with the mouse will
activate some views that display the result of the trading activity:
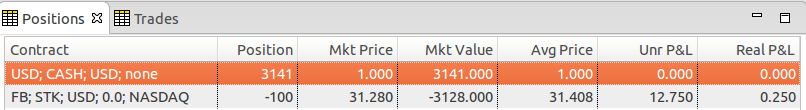
- The Positions view shows the final positions created by the run of the strategy.
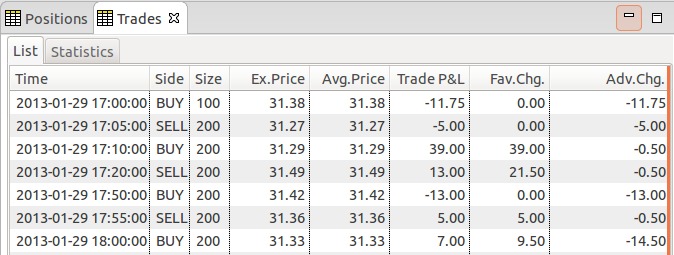
- The Trades view shows the list of trades performed, and some statistics about them.
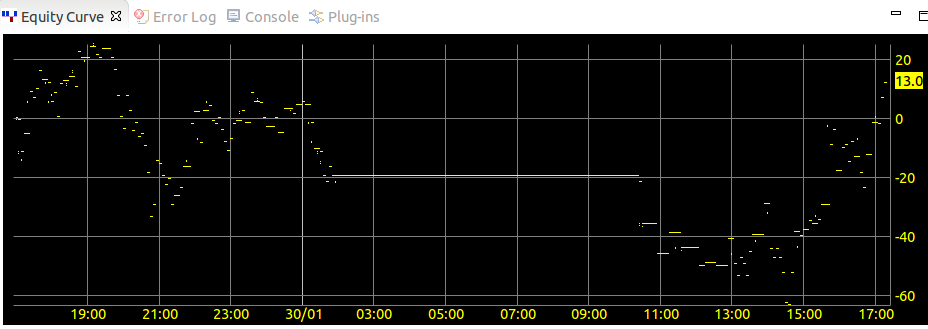
- The Equity curve view shows the evolution of the equity during the trading period.
If the Start live execution is selected instead of Start backtest
in the contextual menu of the binding, the
system starts the currently selected trading agent against the live broker interface.
![]()
A new blue
execution icon will appear, with a green square overlaid (if the green square does not appear,
check the Preferences to enable the decorators, as explained at the beginning of this page).
The agent can be paused, resumed and killed with the corresponding options by right-clicking
on the blue icon.
New trading strategies
Each new strategy available will appear as a robot-shaped icon in the Trading Managers view view. To learn how to develop new trading strategies, go [here](Trading agents).