Week 4 : Detecting left and Right Lanes - lasithaya/Robotics-lasi GitHub Wiki
Detecting left and Right Lanes
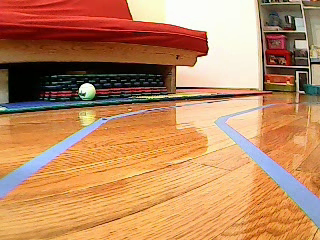
In our previous image processing tutorial, we developed the code for detecting line segments but in order to move the robot inside the two lanes we should be able to categorize these line segments into two lines, namely left and right lanes. Before doing so, let's take a look at a frame photo shown below. The left lane appears to be going upwards so it has a negative slope (remember the coordinate system start point is top left corner). In other words, the left lane line has x1 < x2 and y2 < y1 and the slope = (y2 - y1) / (x2 - x1) which will give a negative slope. Therefore, all lines with negative slopes are considered left lane points. The right lane is the complete opposite, we can see that the right lane is going downwards and will have a positive slope. The right lane has x2 > x1 and y2 > y1 which will give a positive slope. So, all lines with positive slope are considered right lane points. In the case of vertical lines (x1 = x2), the slope will be infinity. In this case, we will skip all vertical lines to prevent getting an error. We will calculate the slope of each line segment and based on the sign of the slope we will combine the line segments into two distinct lines.
Following function implements, the logic explained above
def average_slope_intercept(frame, line_segments):
    """
    This function combines line segments into one or two lane lines
    If all line slopes are < 0: then we only have detected left lane
    If all line slopes are > 0: then we only have detected right lane
    """
    lane_lines = []
    if line_segments is None:
        rospy.loginfo('No line_segment segments detected')
        return lane_lines

    height, width, _ = frame.shape
    left_fit = []
    right_fit = []


    for line_segment in line_segments:
        for x1, y1, x2, y2 in line_segment:
            if x1 == x2:
                #rospy.loginfo('skipping vertical line segment (slope=inf): %s' % line_segment)
                continue
            fit = np.polyfit((x1, x2), (y1, y2), 1)
            slope = fit[0]
            intercept = fit[1]

            if slope < 0:
               left_fit.append((slope, intercept))
            else:
               right_fit.append((slope, intercept))

    left_fit_average = np.average(left_fit, axis=0)
    if len(left_fit) > 0:
        lane_lines.append(make_points(frame, left_fit_average))

    right_fit_average = np.average(right_fit, axis=0)
    if len(right_fit) > 0:
        lane_lines.append(make_points(frame, right_fit_average))


    return lane_lines
make_points() is a helper function for the function above which will return the bounded coordinates of the lane lines (from the bottom to the middle of the frame).
def make_points(frame, line):
    height, width, _ = frame.shape
    slope, intercept = line
    y1 = height  # bottom of the frame
    y2 = int(y1 * 1 / 2)  # make points from middle of the frame down

    # bound the coordinates within the frame
    x1 = max(-width, min(2 * width, int((y1 - intercept) / slope)))
    x2 = max(-width, min(2 * width, int((y2 - intercept) / slope)))
    return [x1, y1, x2, y2](/lasithaya/Robotics-lasi/wiki/x1,-y1,-x2,-y2)
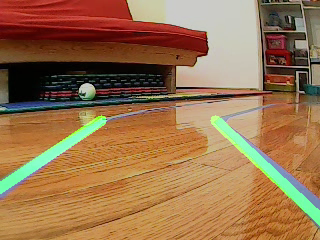
you can use the display_lines function we created earlier to display these images. Once implemented you would see a picture like below.