Dashboards elasticharts stackedbar - kwantu/platformconfiguration GitHub Wiki
Elastic stacked bar
Layout
Layout Fields
| Field | description |
|---|---|
| field | field used to fetch data [list of comma seperated fields] |
| function | the aggr function used to fetch the fields data like sum or average |
| groupBy(1 to 5) | Field on which group by will be applicable |
| xAxis | Field on which the candle category will be decided |
| label | labels for each field respectively |
Note
Only fields defined in field list as comma seperated and groupBy fields are will be retuned in the datasource response
Config
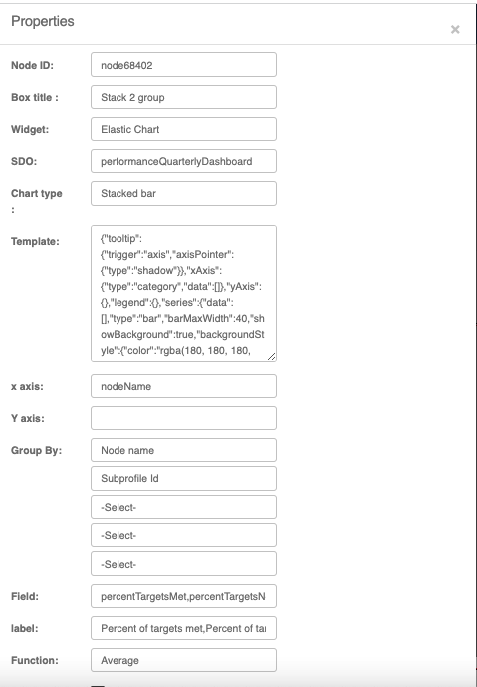
"elasticChart": {
            "sdoSetId": "performanceQuarterlyDashboard:1",
            "uiView": "",
            "canEdit": "",
            "field": "percentTargetsMet,percentTargetsNotMet",
            "chartType": "stackedBar",
            "Label": "Percent of targets met,Percent of targets not met",
            "GroupBy": "nodeName",
            "Xaxis": "nodeName",
            "Yaxis": "",
            "Y1axis": "",
            "template": "{\"tooltip\":{\"trigger\":\"axis\",\"axisPointer\":{\"type\":\"shadow\"}},\"xAxis\":{\"type\":\"category\",\"data\":[]},\"yAxis\":{},\"legend\":{},\"series\":{\"data\":[],\"type\":\"bar\",\"barMaxWidth\":40,\"showBackground\":true,\"backgroundStyle\":{\"color\":\"rgba(180, 180, 180, 0.2)\"}}}",
            "chart": "",
            "workflowStatus": "",
            "functionField": "average",
            "acrossCommunity": false,
            "XaxisGrouping": true,
            "seriesField": "",
            "contextFilter": "",
            "GroupBy2": "_subprofileId",
            "GroupBy3": "",
            "GroupBy4": "",
            "GroupBy5": "",
            "filterMapping": []
          }
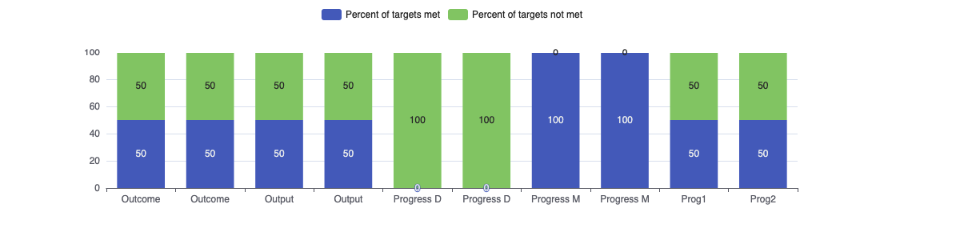
Rendered Chart