Landscapes - kr-colab/colab_wiki GitHub Wiki
To-do
- add plots of real pi, dxy landscapes: humans, drosophila, mimulus
- how do things covary (gene density x diversity, etc.) -- does it depend on scale?
Processes
We get to observe diversity (pi) and divergence (dxy) along the genome. Here's the things we think might plausibly affect those. Everything selection-related has both direct effects (on the nucleotides under selection) and linked effects.
- Mutation
- rate varies along the genome (depending on scale)
- and might vary by nucleotide context
- Drift
- strength is quantified by Ne
- GC biased gene conversion
- varies with recombination (crossover) rate and gene density
- Selection
- "positive" selection (that increases frequencies of rare alleles)
- "negative" selection (that decreases frequencies of rare alleles)
- balancing selection and local adaptation (that keeps polymorphisms around within species)
- Introgression
- positive selection (that tends to increase the frequency of migrant/introgressing alleles between species)
- negative selection: incompatibilities and local adaptation (the opposite)
- Transposable elements and repetitive DNA
- might affect gene density
- in practice can bias diversity-related stats estimation
- Recombination rate
- modulates strength of linked effects
- Gene density
- modulates intensity of targets of selection
Theory
No migration or introgression
In a model of a "clean split" of one species into two that don't have migration,
nucleotide divergence between the two after time T in some region is
dxy(T) = pi[ancestor] + mu_1[eff] * T + mu_2[eff] * T
where mu_A[eff] is the "effective mutation rate" in population A, i.e.,
- the mutation rate multiplied by the probability that a new mutation is found along a lineage, or equivalently
- the mutation rate multiplied by average relative fitness of new mutations. Let's call this
mu_A[eff] = mu * f_A
where f is that second term, which we could call the average "selective filter" strength. (need a better name)
f_A = 2 * N_e * P(Mutation is inherited by a sample in population A today)
which, for example, would be if mutations are being drawn from a distribution of selection coefficient nu(s),
and we are only concerned with fixations,
something like:
P(Mutation is in a sample today)
  = \int_{-\infty}^\infty nu(s) (1 - exp(-4 s Ne/N)) / (1 - exp(-4 s Ne)) ds
More generally, this would be
= \int_0^\infty E[P_t] dt
where P_t is the frequency after time t of a new mutation, where included
in the expectation is averaging over the selection coefficient.
The selective filter strength depends on:
- (+) direct effects of positive selection, and Ne (ie, total influx of new positive mutations)
- (+) GCbGC, and Ne (for the same reason)
- (-) direct effects of negative selection
Migration and/or introgression
Let's call it "introgression" to fix metaphors.
We could think about dxy with introgression conceptually in two ways:
dxy(T) = pi[ancestor] + 2 * mu[eff] * T[MRCA]
where T[MRCA] is the average time since common ancestor, which might be less than the split time because of introgression, or
dxy(T) = (1 - p[intro]) * (pi[ancestor] + 2 * mu[eff] * T) + p[intro] * pi[intro] ,
where p[intro] is the proportion of the genome affected by introgression and pi[intro] is whatever you need to make the equation balance, I guess.
Note that the first equation isn't quite right because the presence of mutations might make a bit of genome more or less likely to introgression,
thus affecting T[MRCA].
I'm not sure how to think about pi[intro] yet - it's like "pi in the other species plus mutations that might have caused introgression,
I think? - if so, substituting pi for pi[intro] would probably be good.
Anyhow p[intro] (which is inversely correlated with T[MRCA]) is affected by:
- both direct and linked effects of positive and negative selection on introgression
- GCbGC (since this will provide positive selection on introgressing GC alleles)
Empirical data
Let's put in images of empirical pi and dxy curves here from different species, along with recombination rates, gene density, and repetetiveness when possible.
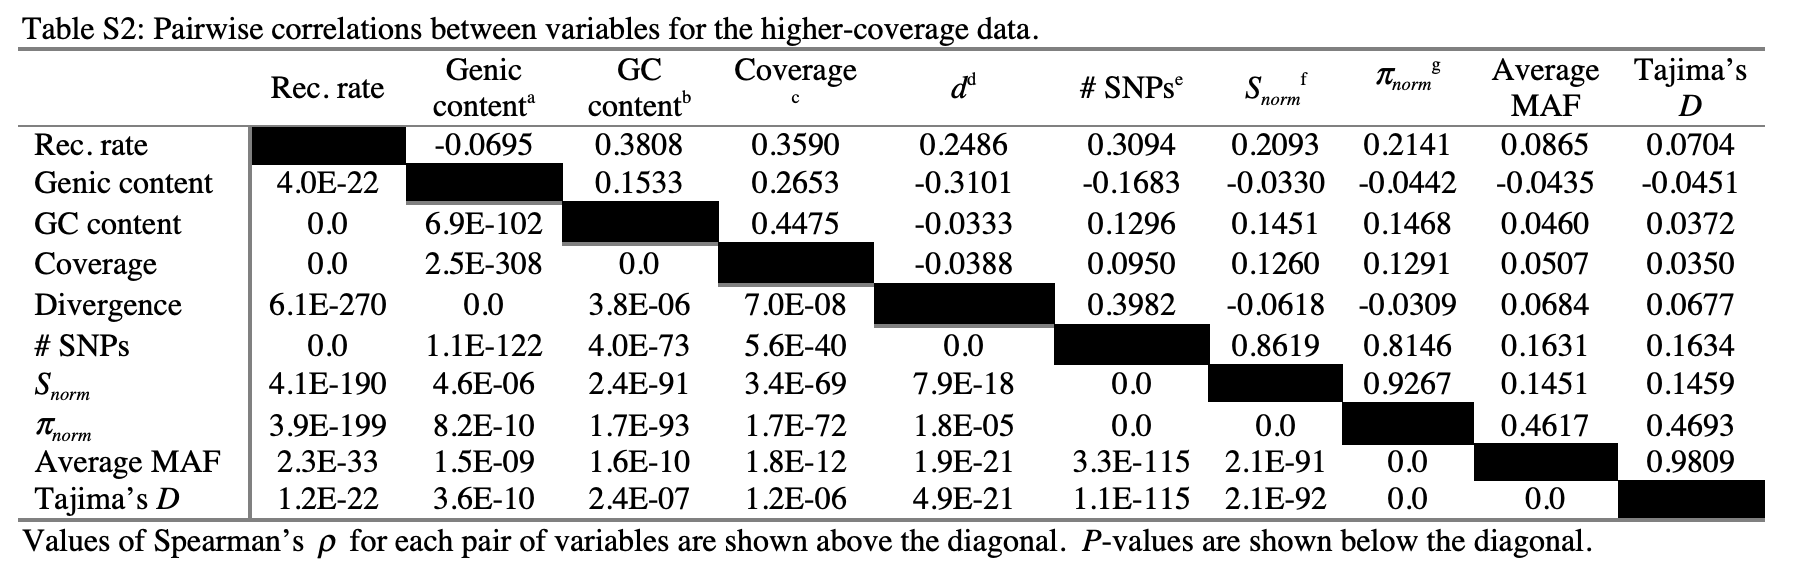
- Pairwise correlations between diversity and genomic features in humans. From: Lohmueller et al. 2012
Where's the signal?
How can we distinguish these different effects? Predictions, ideas for signal.
GC-biased gene conversion
GCbGC will produce differences in pi and dxy when separated out by type of SNP (in particular, whether it changes GCness or not)
(Mutation rate variation and direct effects of selection) versus linked effects
If there's no possibility for introgression, dxy increases with time according to only the effective mutation rate, not linked effects. Looking at how much dxy between distant taxa has increased along recent branches could tell us about this.
Mutation rate variation versus direct effects of positive selection
Direct effects of positive selection (i.e., positive selection on mu[eff]) depend on Ne through the influx of new, positively selected mutations, so should have different effects on branches with different population size.