Computational Resources - kr-colab/colab_wiki GitHub Wiki
We have a ton of computer power in the lab but sometimes it's a lot to keep track of. The goal with this page is to make a guide to those resources, both to help newcomers to the group and to help old folks remember what we have.
Warning: below there's a lot of information about conda. HOWEVER, at time of writing (4/6/23) no-one uses conda because it's unusably slow; everyone uses mamba instead.
sesame is the development server for the group. It's a monsterous machine, which is meant for you to write code on as well as do analysis on. It has 80 Intel Xeon Gold 6148 CPU cores running at 2.40GHz, ~400Gb of RAM, and 2 GeForce RTX 2070 GPUs with 8Gb of memory each.
You can log in to sesame at sesame.uoregon.edu
Specs: 80 cores, 1TB of RAM, and 4 GPUs.
talapas is the HPC cluster here on campus. you can read about it here
We maintain a large partition of the cluster for ourselves. Currently we have 12 nodes that we have priority on that can be using the kern queue on the scheduler. We also have a large storage partition on the talapas system that is accessibled from /projects/kernlab. Make yourself a directory there to store your work. Also there is a bunch of shared data available in that volume-- please feel free to take a look around.
To run a job, you'll need to specify the account and the partition, for instance by setting these at the top of your sbatch script to
#SBATCH --account=kernlab
#SBATCH --partition=kern
The kernlab account currently has two different partitions: kern and kerngpu.
kern represents CPU-only nodes. Specs: 27 nodes, each with 40 cores and 192GB to 385GB of RAM.
kerngpu is for reserving the lab's GPUs: one V100 node, and three A100 nodes.
V100 (n244). Individual node specs: 40 CPUs, 385GB RAM. 4 GPUs, 32510MiB RAM.
A100 (n271-n273). Individual node specs: 64 CPUs, 1TB RAM. 3 GPUs, 40536MiB RAM. Importantly, you're going to need to work with the cluster team to install software on the A100 nodes. For example, to run a specific deep learning analysis you'll request support with a message like "I'm using the kerngpu partition to access the A100 nodes (n271-273) and I'd like to run tensorflow version 2.2. I also need the following python packages for my analysis pipeline: numpy==XX, matplotlib==YY, etc". Although this is a PITA the cluster folks are usually responsive and give you a custom conda environment with a long name, e.g. anaconda-tensorflow2-gpu-20210928-nvidiatest, that you can load from inside the A100 node.
Use the following steps to load the custom env for an A100 job:
conda deactivate- add to job script:
module load miniconda; conda activate <custom env>
Note: if you train using specific software + hardware on an A100, be sure to do your test step also on an A100 node after loading up the same software versions from training.
Additional points for using kerngpu:
- Add the slurm flag
#SBATCH --gres=gpu:1to make the GPU available for your job. - Request a particular node within the
kerngpupartition, e.g. sbatch -w n244 <job_script>
By default, your umask is 0022, which means that new files you create will not be writeable by others in the same group.
To work on a shared directory, therefore, you need to run umask 0002, or else others won't be able to edit or remove
the files you've created.
An easy way to do this is to put umask 0002 in your ~/.bashrc.
Furthermore, you might need to configure git to behave well as a shared repository
(otherwise, other people will get permissions errors when doing git fetch, for instance).
To do this, run
git config core.sharedRepository group,
or edit your .git/config to include the line sharedRepository = true under the [core] section.
Additionally, getfacl and setfacl are helpful for viewing and changing specific user's permissions on talapas,
which can be read about further here.
talapas uses SLURM to manage job scheduling and resources allocation. SLURM decides which jobs to run and in which order to run them. As a user, you have to specify how much resources (e.g., number of cpus, ram memory) your jobs will need. It is important that you allocate the right amount of resources to your jobs, otherwise those resources will be wasted (i.e., they will be allocated in vain to your job and prevent other jobs from using it). It can be tricky to figure out exactly how much ram (in particular) your job will need. To avoid waste, you can always start supplying a conservative amount of resources to your jobs and increase if they fail. A good starting point could be to allocate 4Gb of RAM for every 1 CPU.
Once your job is finalized, you can check exactly how much resources it used and how it terminated by running seff <job-id>;
for instance:
$ seff 24893286
Job ID: 24893286
Cluster: slurm_cluster
User/Group: plr/talapas
State: FAILED (exit code 1)
Cores: 1
CPU Utilized: 00:00:04
CPU Efficiency: 15.38% of 00:00:26 core-walltime
Job Wall-clock time: 00:00:26
Memory Utilized: 0.00 MB (estimated maximum)
Memory Efficiency: 0.00% of 4.88 GB (4.88 GB/node)
Note that if your job is still running, it will look like:
(mint_dev) seff 24893494
Job ID: 24893494
Array Job ID: 24893494_1
Cluster: slurm_cluster
User/Group: jander28/talapas
State: RUNNING
Cores: 1
CPU Utilized: 00:00:00
CPU Efficiency: 0.00% of 00:00:18 core-walltime
Job Wall-clock time: 00:00:18
Memory Utilized: 0.00 MB (estimated maximum)
Memory Efficiency: 0.00% of 10.00 GB (10.00 GB/node)
WARNING: Efficiency statistics may be misleading for RUNNING jobs.
Hence the memory statistics will not be reliable. But once its finished, it looks like:
(mint_dev) seff 24893494
Job ID: 24893494
Array Job ID: 24893494_1
Cluster: slurm_cluster
User/Group: jander28/talapas
State: COMPLETED (exit code 0)
Cores: 1
CPU Utilized: 00:00:56
CPU Efficiency: 52.34% of 00:01:47 core-walltime
Job Wall-clock time: 00:01:47
Memory Utilized: 2.84 GB
Memory Efficiency: 28.45% of 10.00 GB
This is a case where I am over-allocating memory. I should reduce my requirements for future runs if possible (e.g. if not running on a GPU). For repetitive jobs such as replicates of a simulation or processing of multiple, similar sized genomic data, you could:
- run your simulation/pipeline two or three times with a bit more resources than you think it will need
- upon finalization, check how much ram and cpus your jobs used with
seff - adjust the resources allocated with some excess margin (e.g., by allocating 20% more RAM than the mean amount of ram your test jobs used).
If you are using snakemake to manage your analyses, then you could allow snakemake to adapt the amount of resources it uses by using the parameter attempt (see here).
To monitor the space used by users on the kern partition on Talapas and anticipate disk quota errors, one might check the usage with
for USER in `ls /projects/kernlab/`; do
  grep $USER /home/.quota;
done | awk '$2=="kernlab" {print $1": "int($4/1e6)}' | sort -k2,2n
... much faster than du, no permissions issues.
To see info about finished jobs, you can use seff -j <jobid> as above;
however, how do you find out the jobid?
For this you can use sacct (which also can tell you info about the jobs).
For instance, to see some info about all the jobs that you started in the last hour, do
sacct -X --start now-1hours -o jobid,jobname%30,state,exitcode,elapsed
(The %30 is to be able to see the full jobname.)
For instance, here I see one interactive job, one killed due to OOM, and two running jobs:
$ sacct -X --start now-1hours -o jobid,jobname,state,exitcode,elapsed
JobID           JobName      State ExitCode    Elapsed
------------ ---------- ---------- -------- ----------
25704322     smk-test_+ OUT_OF_ME+    0:125   01:08:18
25704325           bash    RUNNING      0:0   01:18:41
25704326     smk-test_+    RUNNING      0:0   00:34:37
25704327     smk-cross+    RUNNING      0:0   00:10:38
25704328     smk-cross+    RUNNING      0:0   00:10:38
To get info about usage, you need to remove the -X, e.g.:
sacct -X --start now-1hours -o jobid,jobname,state,maxrss,avecpu,exitcode,elapsed
To see a list of available fields, see man sacct.
It's useful to be able to query the state of the cluster to know what's going on. A few important tools here are squeue, sinfo, and
seff (already mentioned above). For instance, if we want to see every job that is queued or running on the kern paritition we
can use
$ squeue -p kern
             JOBID PARTITION     NAME     USER    STATE NODELIST(REASON) MIN_CPUS MIN_MEMORY TIME_LIMIT TIME_LEFT
          16313194 kern,kern      loc crehmann  PENDING (Resources) 28 4600M 1-00:00:00 1-00:00:00
          16313267 kern,kern      loc crehmann  PENDING (Priority) 28 4600M 1-00:00:00 1-00:00:00
          16313268 kern,kern      loc crehmann  PENDING (Priority) 28 4600M 1-00:00:00 1-00:00:00
          16313269 kern,kern      loc crehmann  PENDING (Priority) 28 4600M 1-00:00:00 1-00:00:00
          16313439 kern,kern      loc crehmann  PENDING (Priority) 28 4600M 1-00:00:00 1-00:00:00
          16313440 kern,kern      loc crehmann  PENDING (Priority) 28 4600M 1-00:00:00 1-00:00:00
          16313441 kern,kern      loc crehmann  PENDING (Priority) 28 4600M 1-00:00:00 1-00:00:00
          16313444 kern,kern      loc crehmann  PENDING (Priority) 28 4600M 1-00:00:00 1-00:00:00
          16313445 kern,kern      loc crehmann  PENDING (Priority) 28 4600M 1-00:00:00 1-00:00:00
          16313446 kern,kern      loc crehmann  PENDING (Priority) 28 4600M 1-00:00:00 1-00:00:00
          16313498 kern,kern      loc crehmann  PENDING (Priority) 28 4600M 1-00:00:00 1-00:00:00
          16313499 kern,kern      loc crehmann  PENDING (Priority) 28 4600M 1-00:00:00 1-00:00:00
          16313743 kern,kern      loc crehmann  PENDING (Priority) 28 4600M 1-00:00:00 1-00:00:00
          16313744 kern,kern      loc crehmann  PENDING (Priority) 28 4600M 1-00:00:00 1-00:00:00
          16312903      kern      loc crehmann  RUNNING n201 28 4600M 1-00:00:00 21:49:15
          16312904      kern      loc crehmann  RUNNING n248 28 4600M 1-00:00:00 21:49:15
          16312905      kern      loc crehmann  RUNNING n202 28 4600M 1-00:00:00 21:49:15
          16312906      kern      loc crehmann  RUNNING n249 28 4600M 1-00:00:00 21:49:15
          16312907      kern      loc crehmann  RUNNING n203 28 4600M 1-00:00:00 21:49:15
          16312908      kern      loc crehmann  RUNNING n250 28 4600M 1-00:00:00 21:49:15
          16312901      kern branch_e murillor  RUNNING n201 2 72000M 5-00:00:00 4-21:49:15
          16312902      kern branch_e murillor  RUNNING n201 2 72000M 5-00:00:00 4-21:49:15
          16312926      kern      loc crehmann  RUNNING n212 28 4600M 1-00:00:00 21:49:15
          16294871      kern  repeats gcoffing  RUNNING n208 28 376000M 10-00:00:00 6-05:26:26
          16313002      kern      loc crehmann  RUNNING n206 28 4600M 1-00:00:00 22:22:02
          16313001      kern      loc crehmann  RUNNING n253 28 4600M 1-00:00:00 22:19:21
          16313000      kern      loc crehmann  RUNNING n259 28 4600M 1-00:00:00 22:16:15
          16313120      kern      loc crehmann  RUNNING n245 28 4600M 1-00:00:00 23:57:15
          16313041      kern      loc crehmann  RUNNING n211 28 4600M 1-00:00:00 22:49:15
          16313040      kern      loc crehmann  RUNNING n254 28 4600M 1-00:00:00 22:44:50
...
This shows us what jobs are running and what resources they have requested. If want a node level
look at the partition we can instead use sinfo which can be asked to dump a lot of different
information about what each node is up to. Definitely look at the man page associated with it
(man sinfo).
$ sinfo -p kern -N -o "%.6D %.11T %.4c %.8z %.6m %.8d %.6w %.8f %20E %e %C"
 NODES       STATE CPUS    S:C:T MEMORY TMP_DISK WEIGHT AVAIL_FE REASON               FREE_MEM CPUS(A/I/O/T)
     1       mixed   40   2:20:1 376000        0      1 skylake, none                 248821 34/6/0/40
     1       mixed   40   2:20:1 376000        0      1 skylake, none                 261190 28/12/0/40
     1       mixed   40   2:20:1 376000        0      1 skylake, none                 295132 28/12/0/40
     1       mixed   40   2:20:1 376000        0      1 skylake, none                 278201 28/12/0/40
     1       mixed   40   2:20:1 376000        0      1 skylake, none                 288869 28/12/0/40
     1       mixed   40   2:20:1 376000        0      1 skylake, none                 277102 28/12/0/40
     1       mixed   40   2:20:1 376000        0      1 skylake, none                 301950 28/12/0/40
     1       mixed   40   2:20:1 376000        0      1 skylake, none                 338210 28/12/0/40
     1       mixed   40   2:20:1 376000        0      1 skylake, none                 286082 28/12/0/40
     1       mixed   40   2:20:1 376000        0      1 skylake, none                 299499 28/12/0/40
     1        idle   40   2:20:1 184000        0      1 skylake, none                 110710 0/40/0/40
     1       mixed   40   2:20:1 184000        0      1 skylake, none                 108891 28/12/0/40
     1       mixed   40   2:20:1 184000        0      1 skylake, none                 139256 30/10/0/40
     1        idle   40   2:20:1 184000        0      1 skylake, none                 126819 0/40/0/40
     1       mixed   40   2:20:1 184000        0      1 skylake, none                 126255 28/12/0/40
     1       mixed   40   2:20:1 184000        0      1 skylake, none                 138630 28/12/0/40
     1       mixed   40   2:20:1 184000        0      1 skylake, none                 113164 28/12/0/40
     1       mixed   40   2:20:1 184000        0      1 skylake, none                 118285 28/12/0/40
     1   allocated   40   2:20:1 184000        0      1 skylake, none                 75518 40/0/0/40
     1       mixed   40   2:20:1 184000        0      1 skylake, none                 93520 28/12/0/40
     1       mixed   40   2:20:1 184000        0      1 skylake, none                 121998 28/12/0/40
     1       mixed   40   2:20:1 184000        0      1 skylake, none                 106448 28/12/0/40
     1        idle   40   2:20:1 184000        0      1 skylake, none                 159558 0/40/0/40
     1       mixed   40   2:20:1 184000        0      1 skylake, none                 160153 28/12/0/40
     1       mixed   40   2:20:1 184000        0      1 skylake, none                 160959 28/12/0/40
     1       mixed   40   2:20:1 184000        0      1 skylake, none                 162019 28/12/0/40
     1       mixed   40   2:20:1 184000        0      1 skylake, none                 161690 28/12/0/40
this is telling me what each of our 27 nodes in the kern partition are doing currently. Most importantly, I can see in the last two columns the ammount of free RAM on each node as well as the current state of CPU allocation.
Whether your jobs get run on the cluster when it is busy depends on how much resources they are requesting - bigger jobs,
particularly ones with a long wall time,
won't get run very often by the scheduler.
You can get information about how effeciently your jobs have done in the past
with the reportseff command, available as a python package that you need to install.
$ squeue -u <YOUR_USERNAME> --long | awk '{print $1}' | xargs -n1 -I{} scontrol update jobid={} TimeLimit=0-1:00:0. # new time limit
This section assumes you have some familiarity with VSCode, but hopefully makes enough sense if you're brand new to it.
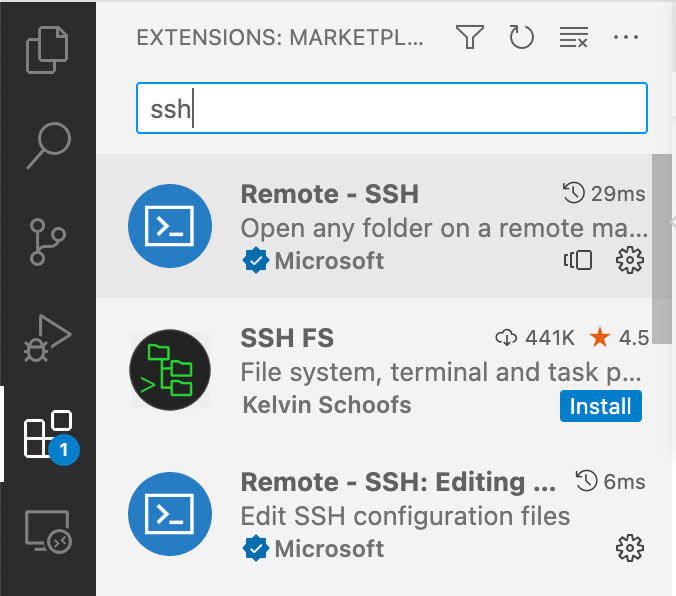
Install the Remote-SSH from the extensions tab (vertical bar on the left looks like 2X2 of block squares with one disconnected).
Next add a new remote host to your local computer's ssh config file.
On unix this can be made or found at ~/.ssh.config,
Host talapas
    HostName talapas-ln1.uoregon.edu
    User your-talapas-username-here
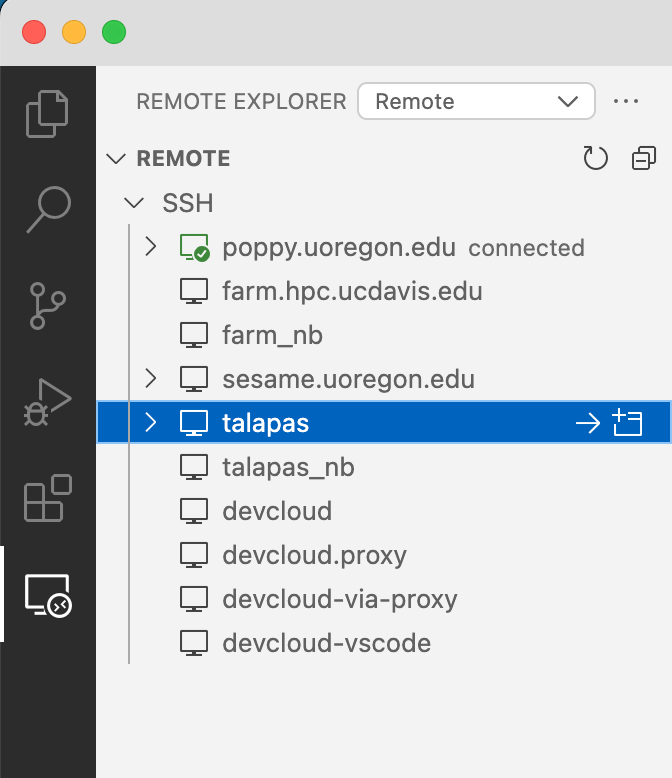
Remote-SSH should have made a "Remote Explorer" tab on the left vertical bar
and you should now have a "talapas" option under the >Remote >SSH menu
(if not, try clicking the refresh button next to ">Remote", quitting and reopening VSCode, or asking a friend).
On that menu, to the right of talapas, you can click on the -> to connect in your current window or the + square to open VSCode on talapas in a new window.
Great, you can now use VSCode as you normally would, but on talapas 😎
But you're on the headnode, so can't do heavy computing.
We can run a Jupyter notebook in VSCode on a talapas node with a few extra steps.
Use your favorite command to start a new interactive session in top or tmux (or whatever to keep it running without you connected)
tmux new -s nb

#4Gb for 8 hours, smoll
srun -v --account kernlab --partition kern --pty --mem 4G --time 8:00:00 bash -ili;
Note which node you were allocated in your bash prompt (mine currently shows stittes@n286 kernlab$)
Now add/edit a second Host in your local computer's ssh config
Host talapas_nb
    HostName n286
    User your-talapas-username-here
    ProxyJump [email protected]
It's important that your HostName node matches the one you were allocated with your srun command.
Talapas will not allow you to ssh on to a node you don't have allocated,
so next steps will fail if the HostName doesn't match an existing allocation.
As above, you should now have a talapas_nb on your Remote Explorer that you can connect to as you would any other remote host.
You can now create a new jupyter notebook that is allocated on a node!

You might prefer the OnDemand approach, but if you already like VSCode this is a nice option . It also makes it simpler to use your conda environments (just "select Kernel" from top right on window)

One way to make sure you've got the python libraries you need,
especially if you need up-to-date tskit, for instance, is to use conda.
First, you need to install your own conda. You can get the link to a different installer script
from this page.
You also need to decide where to install it to - I'm installing it under /projects/haldane/plr/miniconda3:
wget https://repo.anaconda.com/miniconda/Miniconda3-latest-Linux-x86_64.sh
bash Miniconda3-latest-Linux-x86_64.sh -p /projects/haldane/plr/miniconda3
You'll have to say yes to the license, as well as saying yes to
Do you wish the installer to initialize Miniconda3 by running conda init? [yes|no]
Why should you install your own conda? Isn't this the point of having shared computing infrastructure?
Well, it turns out that all this stuff is so fragile that you'll have to "turn it all off and turn it back on again"
before too long, meaning to rm -rf /projects/haldane/plr/miniconda3 and re-install it from scratch.
Then, navigate to the folder your project is in,
and set up an environment:
this will be a python3.8 environment called treestuff:
conda create -n treestuff python=3.8
I'm saying python 3.8 because we need at least 3.7 and I don't know what the default would be.
Ok, now you can "activate" your virtual environment, meaning tell the computer to start using
the python associated which this new environment (and it's packages) you've made!
And, you should verify that you're *actually using the python3 from the environment that you just installed
by checking the location of the program that is called when you run python3:
conda activate treestuff
which python3
# should say /projects/haldane/plr/miniconda3/envs/treestuff/bin/python3
You'll know you're in your new environment because the prompt will say (treestuff) at the start.
You can run conda deactivate twice to turn it off.
Note: which python will give you the same thing, but typing python3 instead of python is a good habit,
since in some systems, python defaults to python2.
Now, install packages that you need. You could install these via conda, but it sometimes works better to just install them with pip, like for instance:
python3 -m pip install tskit msprime pyslim
To run slurm jobs using your new conda environment, you need to activate it before running sbatch;
then your slurm jobs will inherit the environment.
If you'd like to use talapas' jupyter notebooks but in one of your conda environments, there's two options (as of 3/23/23): First, you can create a kernel:
conda activate <your environment>
conda install ipykernel
python -m ipykernel install --user --name <name of kernel> --display-name "a descriptive name"
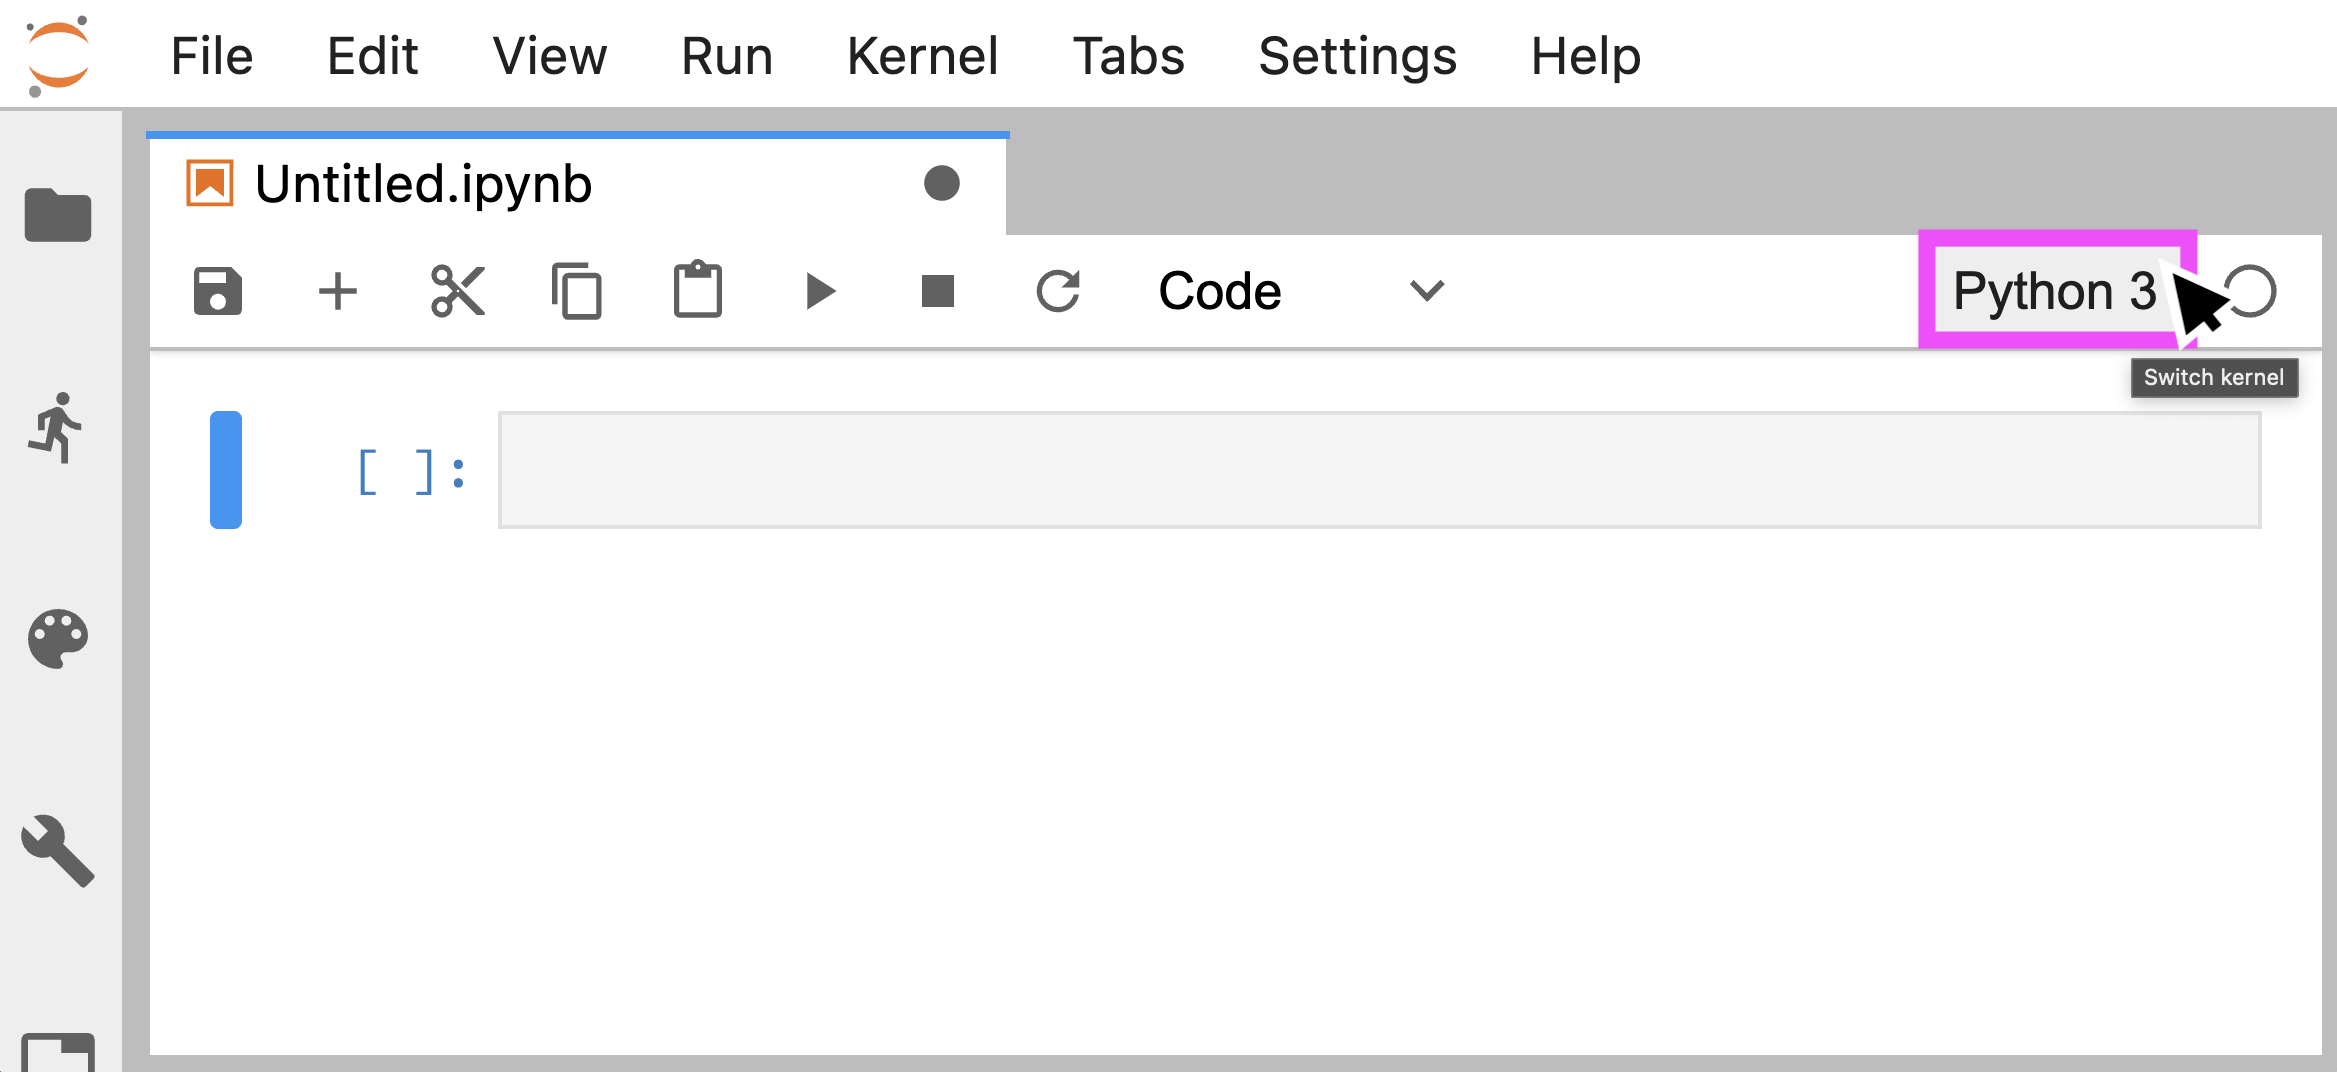
Then, in a running jupyter notebook you should see a little kernel name at the upper right, and clicking on it, get a list of kernels, including the one you've just made.
However, sometimes just the kernel doesn't cut it, since you don't get the modifications to $PATH that conda also makes
and might be important for finding additional software the python modules depend on.
To actually use your conda environments you can (at time of writing)
create a ~/.bashrc-ondemand file that gets run when you start an Open OnDemand session,
so one like this will get your conda going instead of the usual talapas one:
module unload miniconda
<anything-needed-to-enable-your-conda>
conda activate <your environment name>
conda list  # to check your work
You can "check your work" by looking at the logs available via the long link "Session ID" link or looking somewhere like
~/ondemand/data/sys/dashboard/batch_connect/sys/jupyter/output/482b7e04-bd1a-415c-a2b7-3e11f29af869 (where that last string is the session ID).
Great! What about SLiM? You could install & build it locally, but easiest (?) is to install from conda:
conda activate treestuff
conda install SLiM
which slim
# /projects/haldane/plr/miniconda3/envs/treestuff/bin/slim
slim -v
# SLiM version 3.6, built Mar  3 2021 21:33:40
To enable your account to download tensorflow-gpu, you need to first run:
export CONDA_OVERRIDE_CUDA=11.5.1
module load cuda/11.5.1
Then you can install:
conda create -n tf-gpu -c conda-forge -c anaconda tensorflow-gpu
conda activate tf-gpu
First step creates a new virtual environment. Step 2 loads it. Any cluster job should include that call to module load cuda/XX.XX.XX; if it has trouble finding your conda env, give it the full path (conda info to find the path). Also, deactivate your current env before submitting slurm job.
Moving files between all these machines becomes a PITA if you have to constantly type your password. The solution-- set up your SSH keys! A simple walk through of that can be found here
The IP is: 10.128.42.12.
The talapas folks don't want to install GDAL, PROJ, etcetera, so they're hoping we'll all install the R packages that need those libraries using conda. Here's how to do that. (Peter got this to actually work on 7 June 2022.)
-
initialize
module load miniconda(maybe this would work with your own conda also?) -
make an environment, here called
rspatial:
CONDA_OVERRIDE_CUDA="11.3" conda create -q -n rspatial --override-channels -c conda-forge -c defaults jupyterlab r-irkernel ipywidgets nodejs widgetsnbextension r-sf r-raster r-stars r-sp r-rgdal
I don't know what the CUDA thing is doing, and probably the jupyterlab stuff isn't necessary?
-
activate the environment:
conda activate rspatial -
additional R libraries can be installed as usual with
install.packages("xyz"), but this will put the packages in yourR_LIBS_USERdirectory, so don't install any spatial packages that might compile against the underlying libraries that way. To install additional spatial libraries use conda, likeconda install r-tigris. -
do stuff!
Interactive jobs can be launched on Talapas using Open OnDemand. These servers launch from a preexisting list of Python installs. To make a conda environment available in your interactive job, use iPyKernel:
-
activate your target environment
conda activate myenvironment -
install iPyKernel into this conda environment
conda install ipykernel(can also install using pip) -
make the environment a kernel!
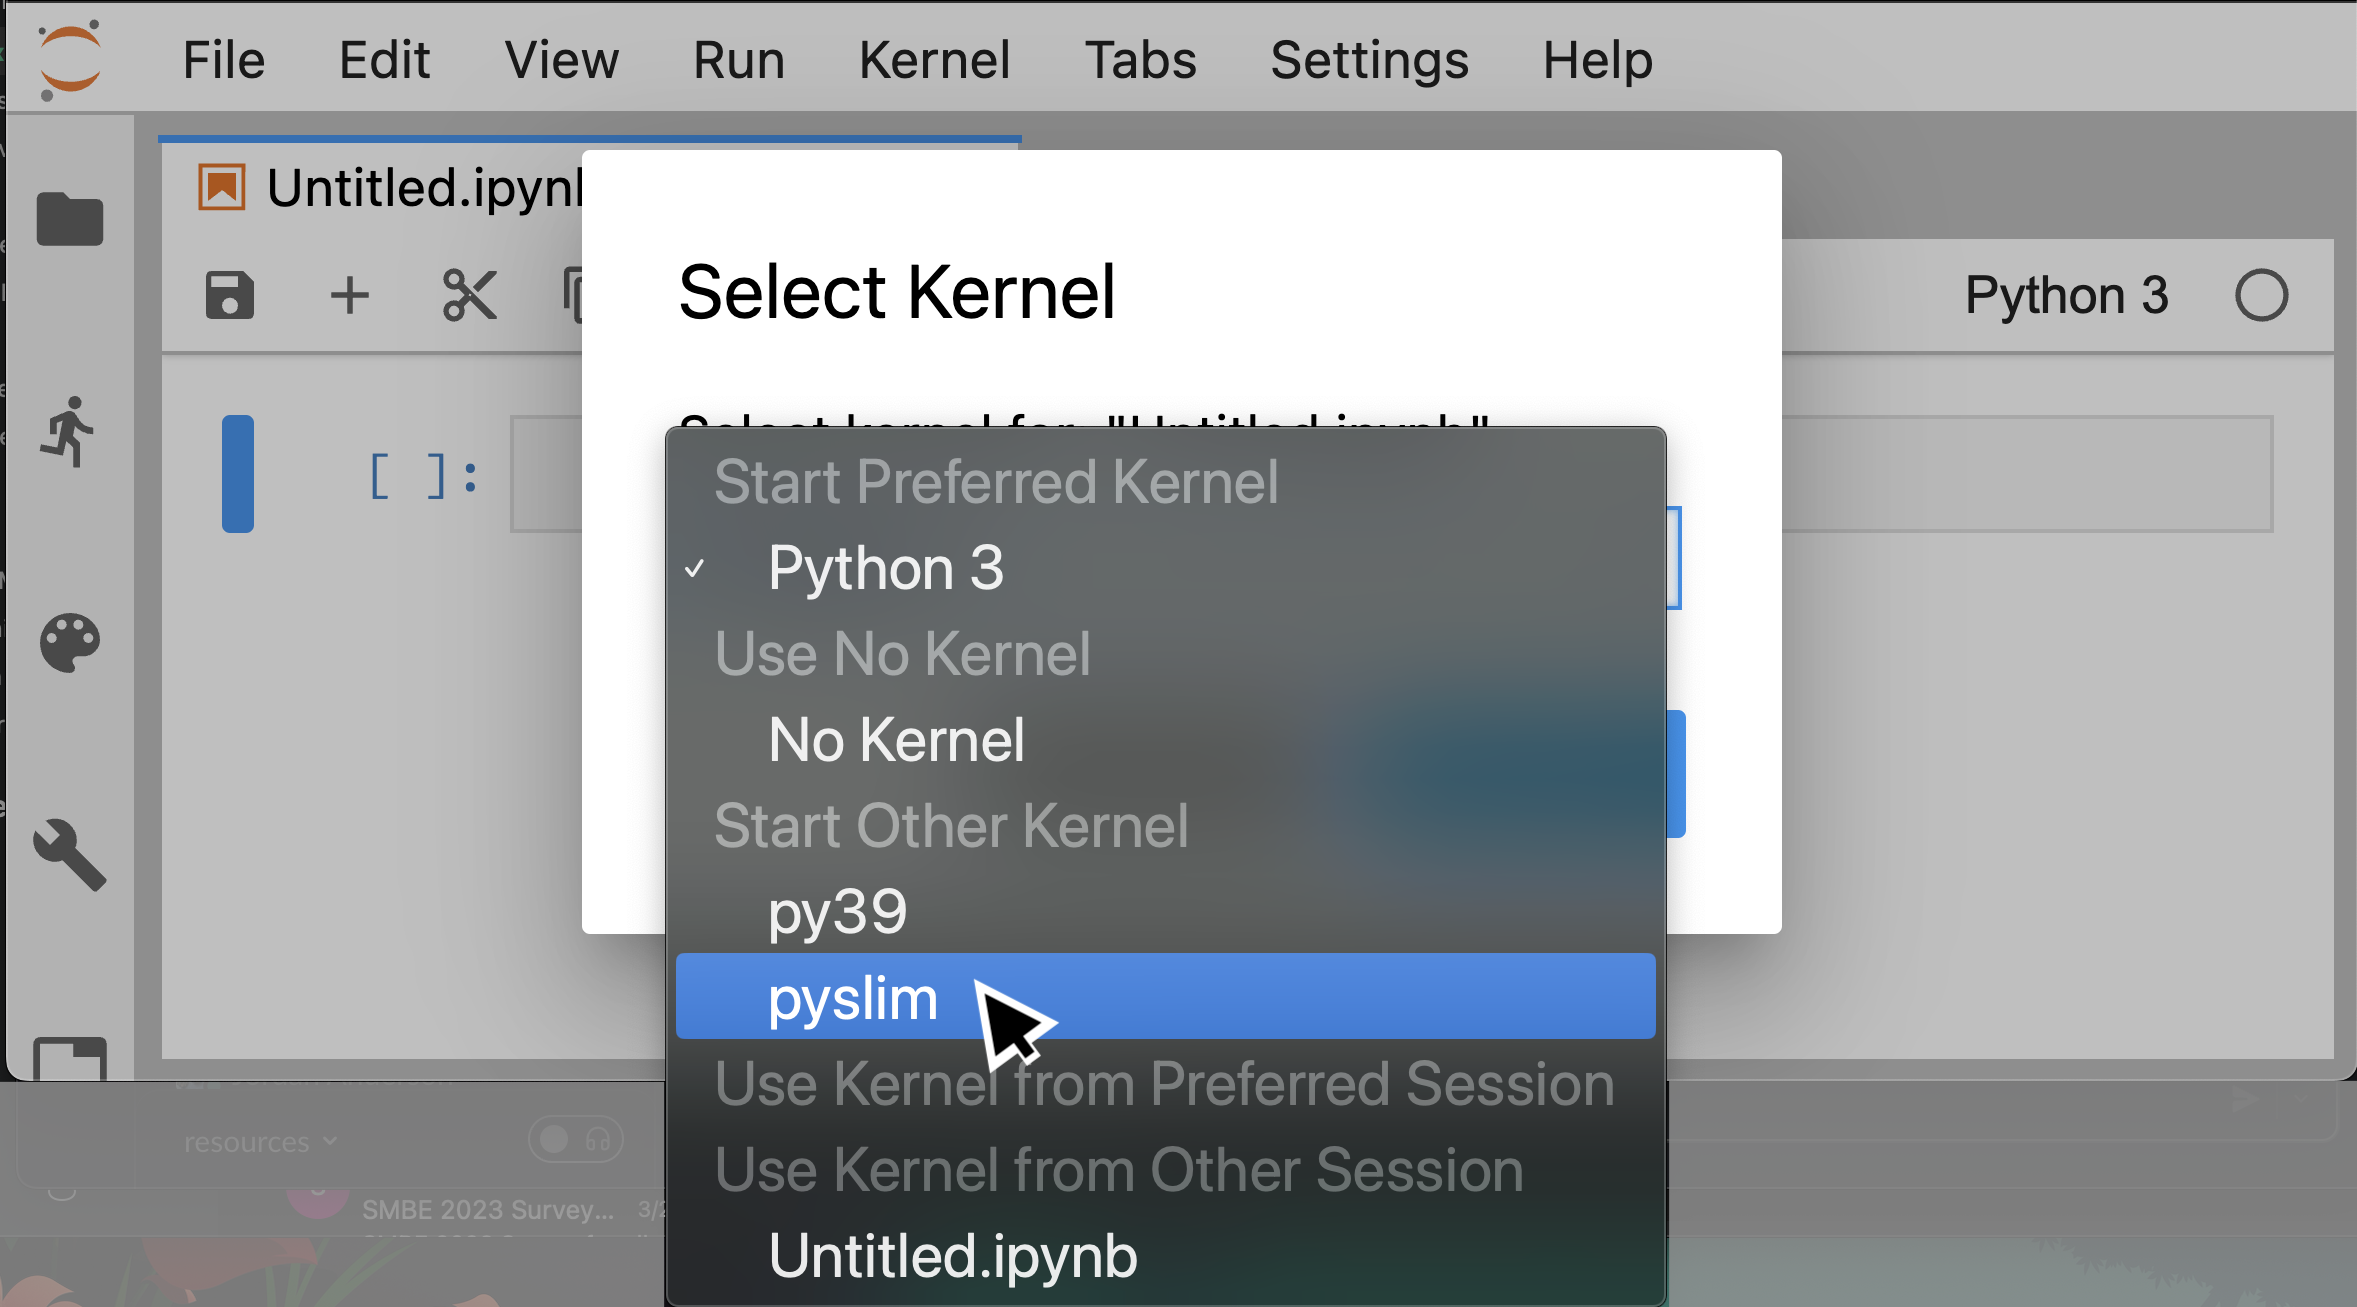
python -m ipykernel install --user --name myenvironment --display-name "My Python Environment"
This environment will now be available as a Jupyter kernel that you can choose in the session:
If your python breaks, especially if it won't load a package that you're sure you've installed, there's a good chance that it's because it's not looking for packages where you think it should be. For a handy guide of where python keeps its packages, see this diagram.
But seriously, here's some things to look at to see if they all match up (e.g., is the python you're running really the one from your conda environment?)
- What version of python?
$ which python
/home/peter/mambaforge/envs/psf/bin/python
- Where are those packages installed from, and by who?
$ pip list -v
Package                            Version     Location                                                     Installer
---------------------------------- ----------- ------------------------------------------------------------ ---------
aioeasywebdav                      2.4.0       /home/peter/mambaforge/envs/psf/lib/python3.10/site-packages conda
aiofiles                           22.1.0      /home/peter/mambaforge/envs/psf/lib/python3.10/site-packages conda
aiohttp                            3.7.4.post0 /home/peter/mambaforge/envs/psf/lib/python3.10/site-packages conda
aiosqlite                          0.18.0      /home/peter/mambaforge/envs/psf/lib/python3.10/site-packages conda
alabaster                          0.7.12      /home/peter/.local/lib/python3.10/site-packages              pip
- Where does python look for modules? We can see this in
sys.path; earlier entries take precedence.
$ python
>>> import sys
>>> sys.path
['', '/home/peter/mambaforge/envs/psf/lib/python310.zip', '/home/peter/mambaforge/envs/psf/lib/python3.10', '/home/peter/mambaforge/envs/psf/lib/python3.10/lib-dynload', '/home/peter/.local/lib/python3.10/site-packages', '/home/peter/mambaforge/envs/psf/lib/python3.10/site-packages']
(Note that one of those entries is not in the conda environment; it's from
>>> import site
>>> site.USER_SITE
'/home/peter/.local/lib/python3.10/site-packages'
and is actually taking precedence over the conda-installed packages that would end up in the last directory in sys.path.)
- Note that executables like
jupyterare just a thin wrapper around something likeimport jupyter_core, and so even ifwhich jupytershows something in your conda directory, the jupyter package that it loads might be elsewhere (yes this happens).
import os
import gpustat

stats = gpustat.GPUStatCollection.new_query()
ids = map(lambda gpu: int(gpu.entry['index']), stats)
ratios = map(lambda gpu: float(gpu.entry['memory.used'])/float(gpu.entry['memory.total']), stats)
bestGPU = min(zip(ids, ratios), key=lambda x: x[1])[0]
os.environ['CUDA_VISIBLE_DEVICES'] = str(bestGPU)Ubuntu uses unattended-upgrades to automatically update some packages (e.g. core libraries).
Nvidia libraries and drivers are included by default; an unfortunate consequence is that once
the drivers update then all GPUs will be offline until a reboot. Nvidia drivers can be excluded
from automatic updates by editing the Unattended-Upgrade::Package-Blacklist section of
/etc/apt/apt.conf.d/50unattended-upgrades.