Lesson 3: Basics Of Pandas v2 - kode2go/python-pandas GitHub Wiki
Basics
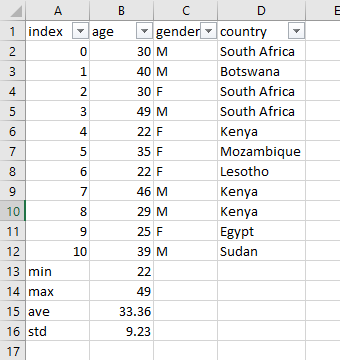
Now the we learnt to do most of the excel functions in Python using the following as a reference:
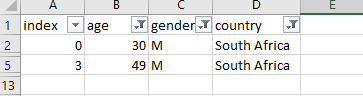
However, we were not able to do the following yet:
We could have used a combination of for loops and conditional statements but it will just become messy! It is time to learn the proper way to do things for data science. That is to use a Python library called Pandas that has many modules ideal for data science.
To use Pandas we need to import it as using import pandas as pd. The as pd part is a just an alias we will use. Next, we need to store our data into a new data type, that is similar to a Dictionary but far more versatile, this is called a DataFrame and its unique to Pandas. This is done done in two ways. The first uses a grouped lists and the second uses a dictionary:
import pandas as pd

index=[0, 1, 2, 3, 4, 5, 6, 7, 8, 9, 10]
age=[39, 25, 29, 46, 22, 35, 22, 49, 30, 40, 30]
gender = ["M","M","F","M","F","F","F","M","M","F","M"]
country = ["South Africa","Botswana","South Africa","South Africa","Kenya","Mozambique","Lesotho","Kenya","Kenya","Egypt","Sudan"]

group_list = [index,age,gender,country]

df_list = pd.DataFrame(group_list)

# transpose of dataframe
df_list = df_list.transpose()

# specifying column names
df_list.columns = ['Index', 'Age', 'Gender','Country']

print("Dataframe from grouped lists:")
print(df_list)

# Using a dictionary

dataset = {'Index': index, 'Age': age,'Gender': gender,'Country':country}

df = pd.DataFrame.from_dict(dataset)
df.drop(['Index'],inplace=True,axis=1)

print("Dataframe from dictionary:")
print(df)
Output:
Dataframe from grouped lists
   Index Age Gender       Country
0      0  39      M  South Africa
1      1  25      M      Botswana
2      2  29      F  South Africa
3      3  46      M  South Africa
4      4  22      F         Kenya
5      5  35      F    Mozambique
6      6  22      F       Lesotho
7      7  49      M         Kenya
8      8  30      M         Kenya
9      9  40      F         Egypt
10    10  30      M         Sudan
Dataframe from dictionary
    Index  Age Gender       Country
0       0   39      M  South Africa
1       1   25      M      Botswana
2       2   29      F  South Africa
3       3   46      M  South Africa
4       4   22      F         Kenya
5       5   35      F    Mozambique
6       6   22      F       Lesotho
7       7   49      M         Kenya
8       8   30      M         Kenya
9       9   40      F         Egypt
10     10   30      M         Sudan
So you can see we get the identical layout as we got with excel. You would have noticed that using the Dictionary approach was far quicker so we will use that in future. Also, doing it with a grouped lists requires us to do some extra processing of the data like transposing the data and convert the Age column back to integers.
Now you would have noticed that Pandas generates an index for us already so the Index column is redundant. So there are two ways to deal with this. The first is to remove it by just adding the following to the code:
df.drop(['Index'],inplace=True,axis=1)
Output:
    Age Gender       Country
0    39      M  South Africa
1    25      M      Botswana
2    29      F  South Africa
3    46      M  South Africa
4    22      F         Kenya
5    35      F    Mozambique
6    22      F       Lesotho
7    49      M         Kenya
8    30      M         Kenya
9    40      F         Egypt
10   30      M         Sudan
You see I used df.drop(). The drop() part is known as a method that can applied to the df dataframe. Note that anytime in Python when you see a dataframe with a dot . followed by some text followed by brackets () it is known as a method. So what is the drop() method doing. It has three parameters that it uses. The first specifies what column it should drop, here it is Index, secondly it specifies if you want to make the changes permanent to the original dataframe with inplace=True, lastly it specifies if you want to remove a row (axis=0) or column (axis=1).
More on axis=0 vs axis=1:
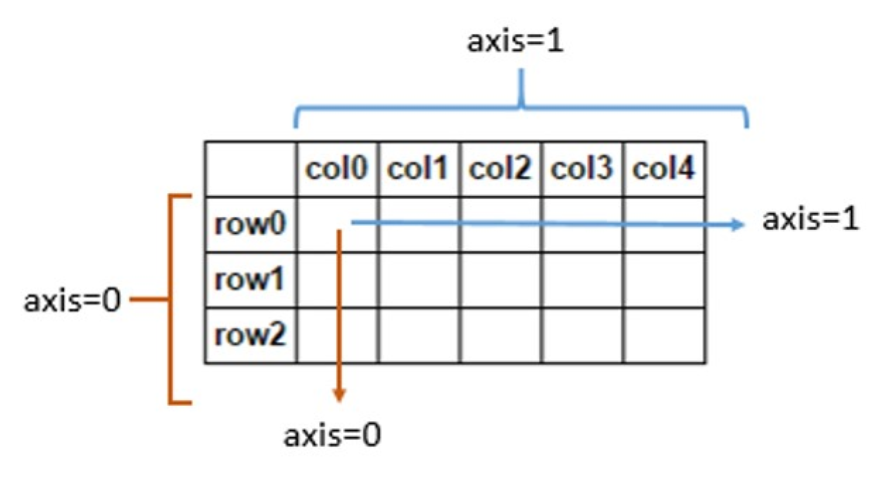
This comes up a lot. So let us tackle this here. By default axis=0 for most methods and functions. So axis=0 will perform the action along the rows (namely, index in pandas), and axis=1 along the columns. For added clarity, one may choose to specify axis='index' (instead of axis=0) or axis='columns' (instead of axis=1).
So:
- Axis 0 will act on all the ROWS in each COLUMN
- Axis 1 will act on all the COLUMNS in each ROW
To visualize it better:
Exploratory Data Analysis (EDA)
Ok great so now that we have a Dataframe, what do we do with it? The most important thing to do is to first analyze the data using the info() method as follows:
print(df.info())
Output:
<class 'pandas.core.frame.DataFrame'>
RangeIndex: 11 entries, 0 to 10
Data columns (total 3 columns):
 #   Column   Non-Null Count  Dtype
---  ------   --------------  -----
 0   Age      11 non-null     int64
 1   Gender   11 non-null     object
 2   Country  11 non-null     object
dtypes: int64(1), object(2)
memory usage: 392.0+ bytes
None
Most important is to notice that all the data is there in the correct format. Notice the Dtype column shows int64 and object. As you probably might remember from previous lessons int and int64 refers to integer data types. The object data type refers to strings.
The next analysis to do is to do a us the describe() method:
print(df.describe(include='all'))
Output:
              Age Gender       Country
count   11.000000     11            11
unique        NaN      2             7
top           NaN      M  South Africa
freq          NaN      6             3
mean    33.363636    NaN           NaN
std      9.233339    NaN           NaN
min     22.000000    NaN           NaN
25%     27.000000    NaN           NaN
50%     30.000000    NaN           NaN
75%     39.500000    NaN           NaN
max     49.000000    NaN           NaN
You can leave out the include=all part and you will only get statistics on the Age column as it can only perform mean, std, min and so on on numeric data. So by default Pandas works out for you some statistics with just one command. You can specify a column with print(df["Age"].describe()) for example.
Adding And Editing Data
Just like you can drop columns you can also add them by doing the following:
index2=[0, 1, 2, 3, 4, 5, 6, 7, 8, 9, 10]

df["Index2"] = index2
To modify any data you can do that with loc() or at() as follows:
df.at[0,"Age"]=100
print(df["Age"](/kode2go/python-pandas/wiki/"Age"))
Output
    Age
0   100
1    25
2    29
3    46
4    22
5    35
6    22
7    49
8    30
9    40
10   30
Note that this will not edit the original data set only a copy that you are working with.
To change the original data you would need:
df["Age"][0]=100
print(df["Age"](/kode2go/python-pandas/wiki/"Age"))
But this can cause warning to pop up. It would be better to create a copy of the dataframe and then edit it:
See this link for more info: https://stackoverflow.com/questions/20625582/how-to-deal-with-settingwithcopywarning-in-pandas https://www.dataquest.io/blog/settingwithcopywarning/
Accessing Specific Data
If we only want to access the Age column we can do the following (note the extra double brackets!):
print(df["Age"](/kode2go/python-pandas/wiki/"Age"))
Output:
    Age
0    39
1    25
2    29
3    46
4    22
5    35
6    22
7    49
8    30
9    40
10   30
To access multiple columns use the following:
print(df["Age","Gender","Country"](/kode2go/python-pandas/wiki/"Age","Gender","Country"))
Output
    Age Gender       Country
0    39      M  South Africa
1    25      M      Botswana
2    29      F  South Africa
3    46      M  South Africa
4    22      F         Kenya
5    35      F    Mozambique
6    22      F       Lesotho
7    49      M         Kenya
8    30      M         Kenya
9    40      F         Egypt
10   30      M         Sudan
Now to access a certain range for we do the following:
print(df["Age","Gender","Country"](/kode2go/python-pandas/wiki/"Age","Gender","Country")[0:5])
Output
   Age Gender       Country
0   39      M  South Africa
1   25      M      Botswana
2   29      F  South Africa
3   46      M  South Africa
4   22      F         Kenya
Filtering Data
Now let us filter the data so that we only what people that are above the age of 35:
filter_age_gt_35 = df["Age"] > 35

print(filter_age_gt_35)

print(df[filter_age_gt_35])
Ouptut
0      True
1     False
2     False
3      True
4     False
5     False
6     False
7      True
8     False
9      True
10    False
Name: Age, dtype: bool
   Age Gender       Country
0   39      M  South Africa
3   46      M  South Africa
7   49      M         Kenya
9   40      F         Egypt
Now what if you only want to see columns Age and Gender. There are a few ways. The first is to save a new dataframe with the filtered data:
above_35_df = df[filter_age_gt_35]

print(above_35_df["Age","Gender"](/kode2go/python-pandas/wiki/"Age","Gender"))
Output:
   Age Gender
0   39      M
3   46      M
7   49      M
9   40      F
Or do it in one line without saving a new dataframe you can use the loc() method:
print(df.loc[filter_age_gt_35,["Age","Gender"]])
Output:
   Age Gender
0   39      M
3   46      M
7   49      M
9   40      F
The loc() method is quite useful as it gives you direct access to specific rows or columns based on their labels. Then there is also a similar method called iloc() which allows you to access data based on the index ranges.
Both loc and iloc allow input to be a single value. We can use the following syntax for data selection:
- loc[row_label, column_label]
- iloc[row_position, column_position]
print(df.loc[1]["Age"])
print(df.iloc[1][0])
Output:
25
25
Filtering With Multiple Conditions
So we first created a filter variable that filters the entire dataframe when Age is greater than 35 which gives a single column or series of Boolean (True/False) data. Then we apply it to the same dataframe and get our result.
Now what if we want to see people above the age of 30, who are male and are from South Africa:
filter_gt_35_M_SA = (df["Age"] > 35) & (df["Gender"] == "M") & (df["Country"] == "South Africa")

print(df[filter_gt_35_M_SA])
Output
   Age Gender       Country
0   39      M  South Africa
3   46      M  South Africa
Which was the same as the excel filter function. Note, the only new feature we added was to have more conditions. To do that we just use the ampersand symbol & for each new condition with brackets ().
Plotting
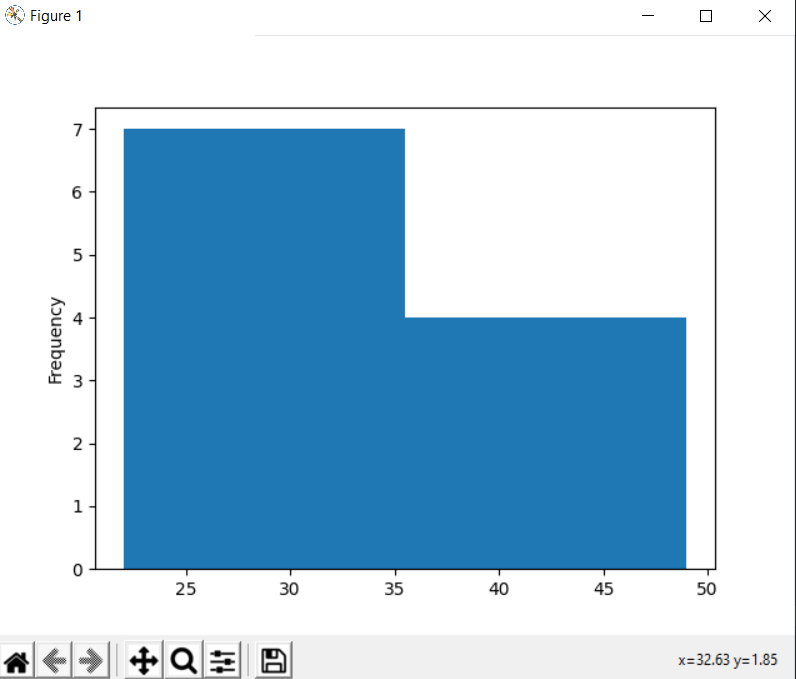
If we want to plot the Age column like we did in excel we use:
ax = df["Age"].plot.hist(bins=2)
Output:
And to add some features to the plot:
ax = df["Age"].plot.hist(bins=2)
ax.set_title("Age Distribution")
ax.set_xlabel('Age')
ax.set_ylabel('Frequency')
ax.grid()
Output:
Reordering Columns
# Method 1: Copy DataFrame to another with columns in desired order
df2 = df['Gender','Age','Country'](/kode2go/python-pandas/wiki/'Gender','Age','Country')

# Method 2: Pop and insert method
country_column = df2.pop('Country')
df2.insert(0,'Country',country_column )
Sorting and Grouping:
If we want to sort the Age column ascending order we can do it with:
print(df.sort_values(by="Age"))
Output
    Age Gender       Country
4    22      F         Kenya
6    22      F       Lesotho
1    25      M      Botswana
2    29      F  South Africa
8    30      M         Kenya
10   30      M         Sudan
5    35      F    Mozambique
0    39      M  South Africa
9    40      F         Egypt
3    46      M  South Africa
7    49      M         Kenya
If we want to group the men and women by the their mean age:
print(df.groupby("Gender")["Age","Gender"](/kode2go/python-pandas/wiki/"Age","Gender").mean())
Output
         Age
Gender
F       29.6
M       36.5
Or country by the mean age:
print(df.groupby("Country")["Age"].mean())
Output:
Country
Botswana        25.000000
Egypt           40.000000
Kenya           33.666667
Lesotho         22.000000
Mozambique      35.000000
South Africa    38.000000
Sudan           30.000000
Name: Age, dtype: float64