Lesson 1: Overview - kode2go/python-pandas GitHub Wiki
Know Your Data
To analyze data, it is important to know what type of data we are dealing with.
We can split the data types into three main categories:
-
Numerical
-
Categorical
-
Ordinal
Numerical data are numbers, and can be split into two numerical categories:
Discrete Data:
- numbers that are limited to integers. Example: The number of cars passing by.
Continuous Data:
- numbers that are of infinite value. Example: The price of an item, or the size of an item
Categorical data are values that cannot be measured up against each other. Example: a color value, or any yes/no values.
Ordinal data are like categorical data, but can be measured up against each other. Example: school grades where A is better than B and so on.
By knowing the data type of your data source, you will be able to know what technique to use when analyzing them.
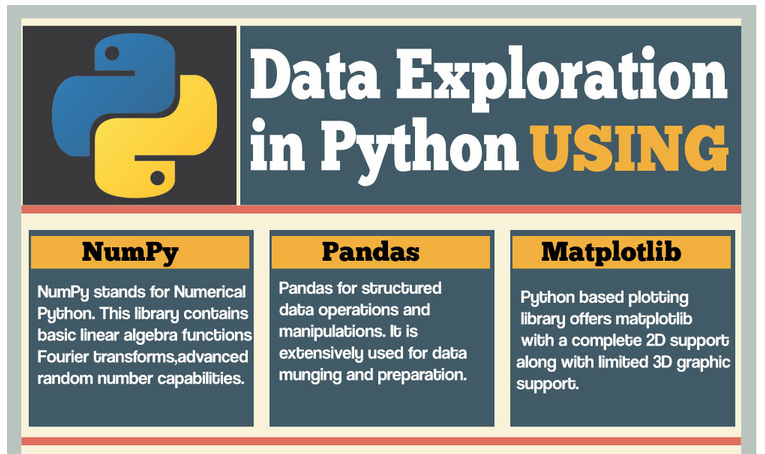
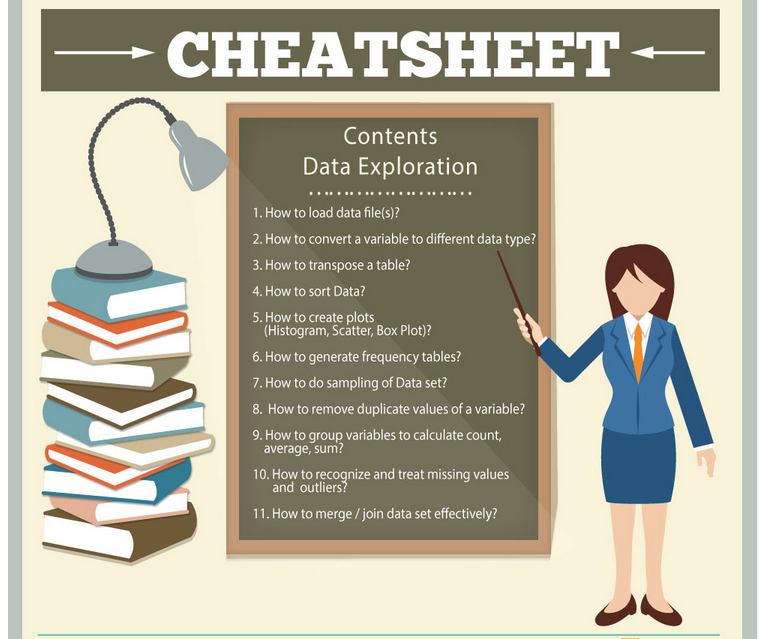
Learning the basics of Exploratory Data Analysis using Python with Numpy, Matplotlib, and Pandas.
1. Data Cleaning
It is very important to get rid of the irregularities and clean the data after sourcing it into our system. Irregularities are of different types of data.
- Missing Values
- Incorrect Format
- Incorrect Headers
- Anomalies/Outliers
2. Bivariate Analysis
When we talk about bivariate analysis, it means analyzing 2 variables. Since we know there are numerical and categorical variables, there is a way of analyzing these variables as shown below:
3. Numerical vs. Numerical
3.1. Scatterplot
3.2. Line plot
3.3. Heatmap for correlation
3.4. Joint plot
4. Categorical vs. Numerical
4.1. Bar chart
4.2. Violin plot
4.3. Categorical box plot
4.4. Swarm plot
5. Two Categorical Variables
5.1. Bar chart
5.2. Grouped bar chart
5.3. Point plot
6. Normalizing and Scaling
Often the variables of the data set are of different scales i.e. one variable is in millions and others in only 100. For e.g. in our data set Income is having values in thousands and age in just two digits. Since the data in these variables are of different scales, it is tough to compare these variables.
Feature scaling (also known as data normalization) is the method used to standardize the range of features of data. Since the range of values of data may vary widely, it becomes a necessary step in data preprocessing while using machine learning algorithms.
In this method, we convert variables with different scales of measurements into a single scale. StandardScaler normalizes the data using the formula (x-mean)/standard deviation. We will be doing this only for the numerical variables.