BPF Performance Tools - kimschles/schlesinger-knowledge GitHub Wiki
BFP Performance Tools
Brenden Gregg https://github.com/brendangregg/bpf-perf-workshop
BPF (eBPF) tracing is the superpower that can analyze everything, helping you find performance wins, troubleshoot software, and more. This tutorial shows you how to use the open-source BCC and bpftrace tools to find performance wins across a variety of application and system targets, and how to create your own Linux observability tools with BPF/bpftrace. We will also discuss challenges and fixes for real-world analysis, including lessons learned from its production use at Netflix, so you can hit the ground running when you return to work.
Learning Objectives note: I revised the verbs
- Describe BPF, BCC and bpftrace
- Use bcc tools to
- analyze disk i/o issues
- short-lived process issues
- runq latency issues
- Develop at least one new bpftrace tool
Describe BPF, BCC and bpftrace
BPF stands for Berkeley Packet Filter.
Lab 1
http://www.brendangregg.com/blog/images/2019/bpf_performance_tools_book.png
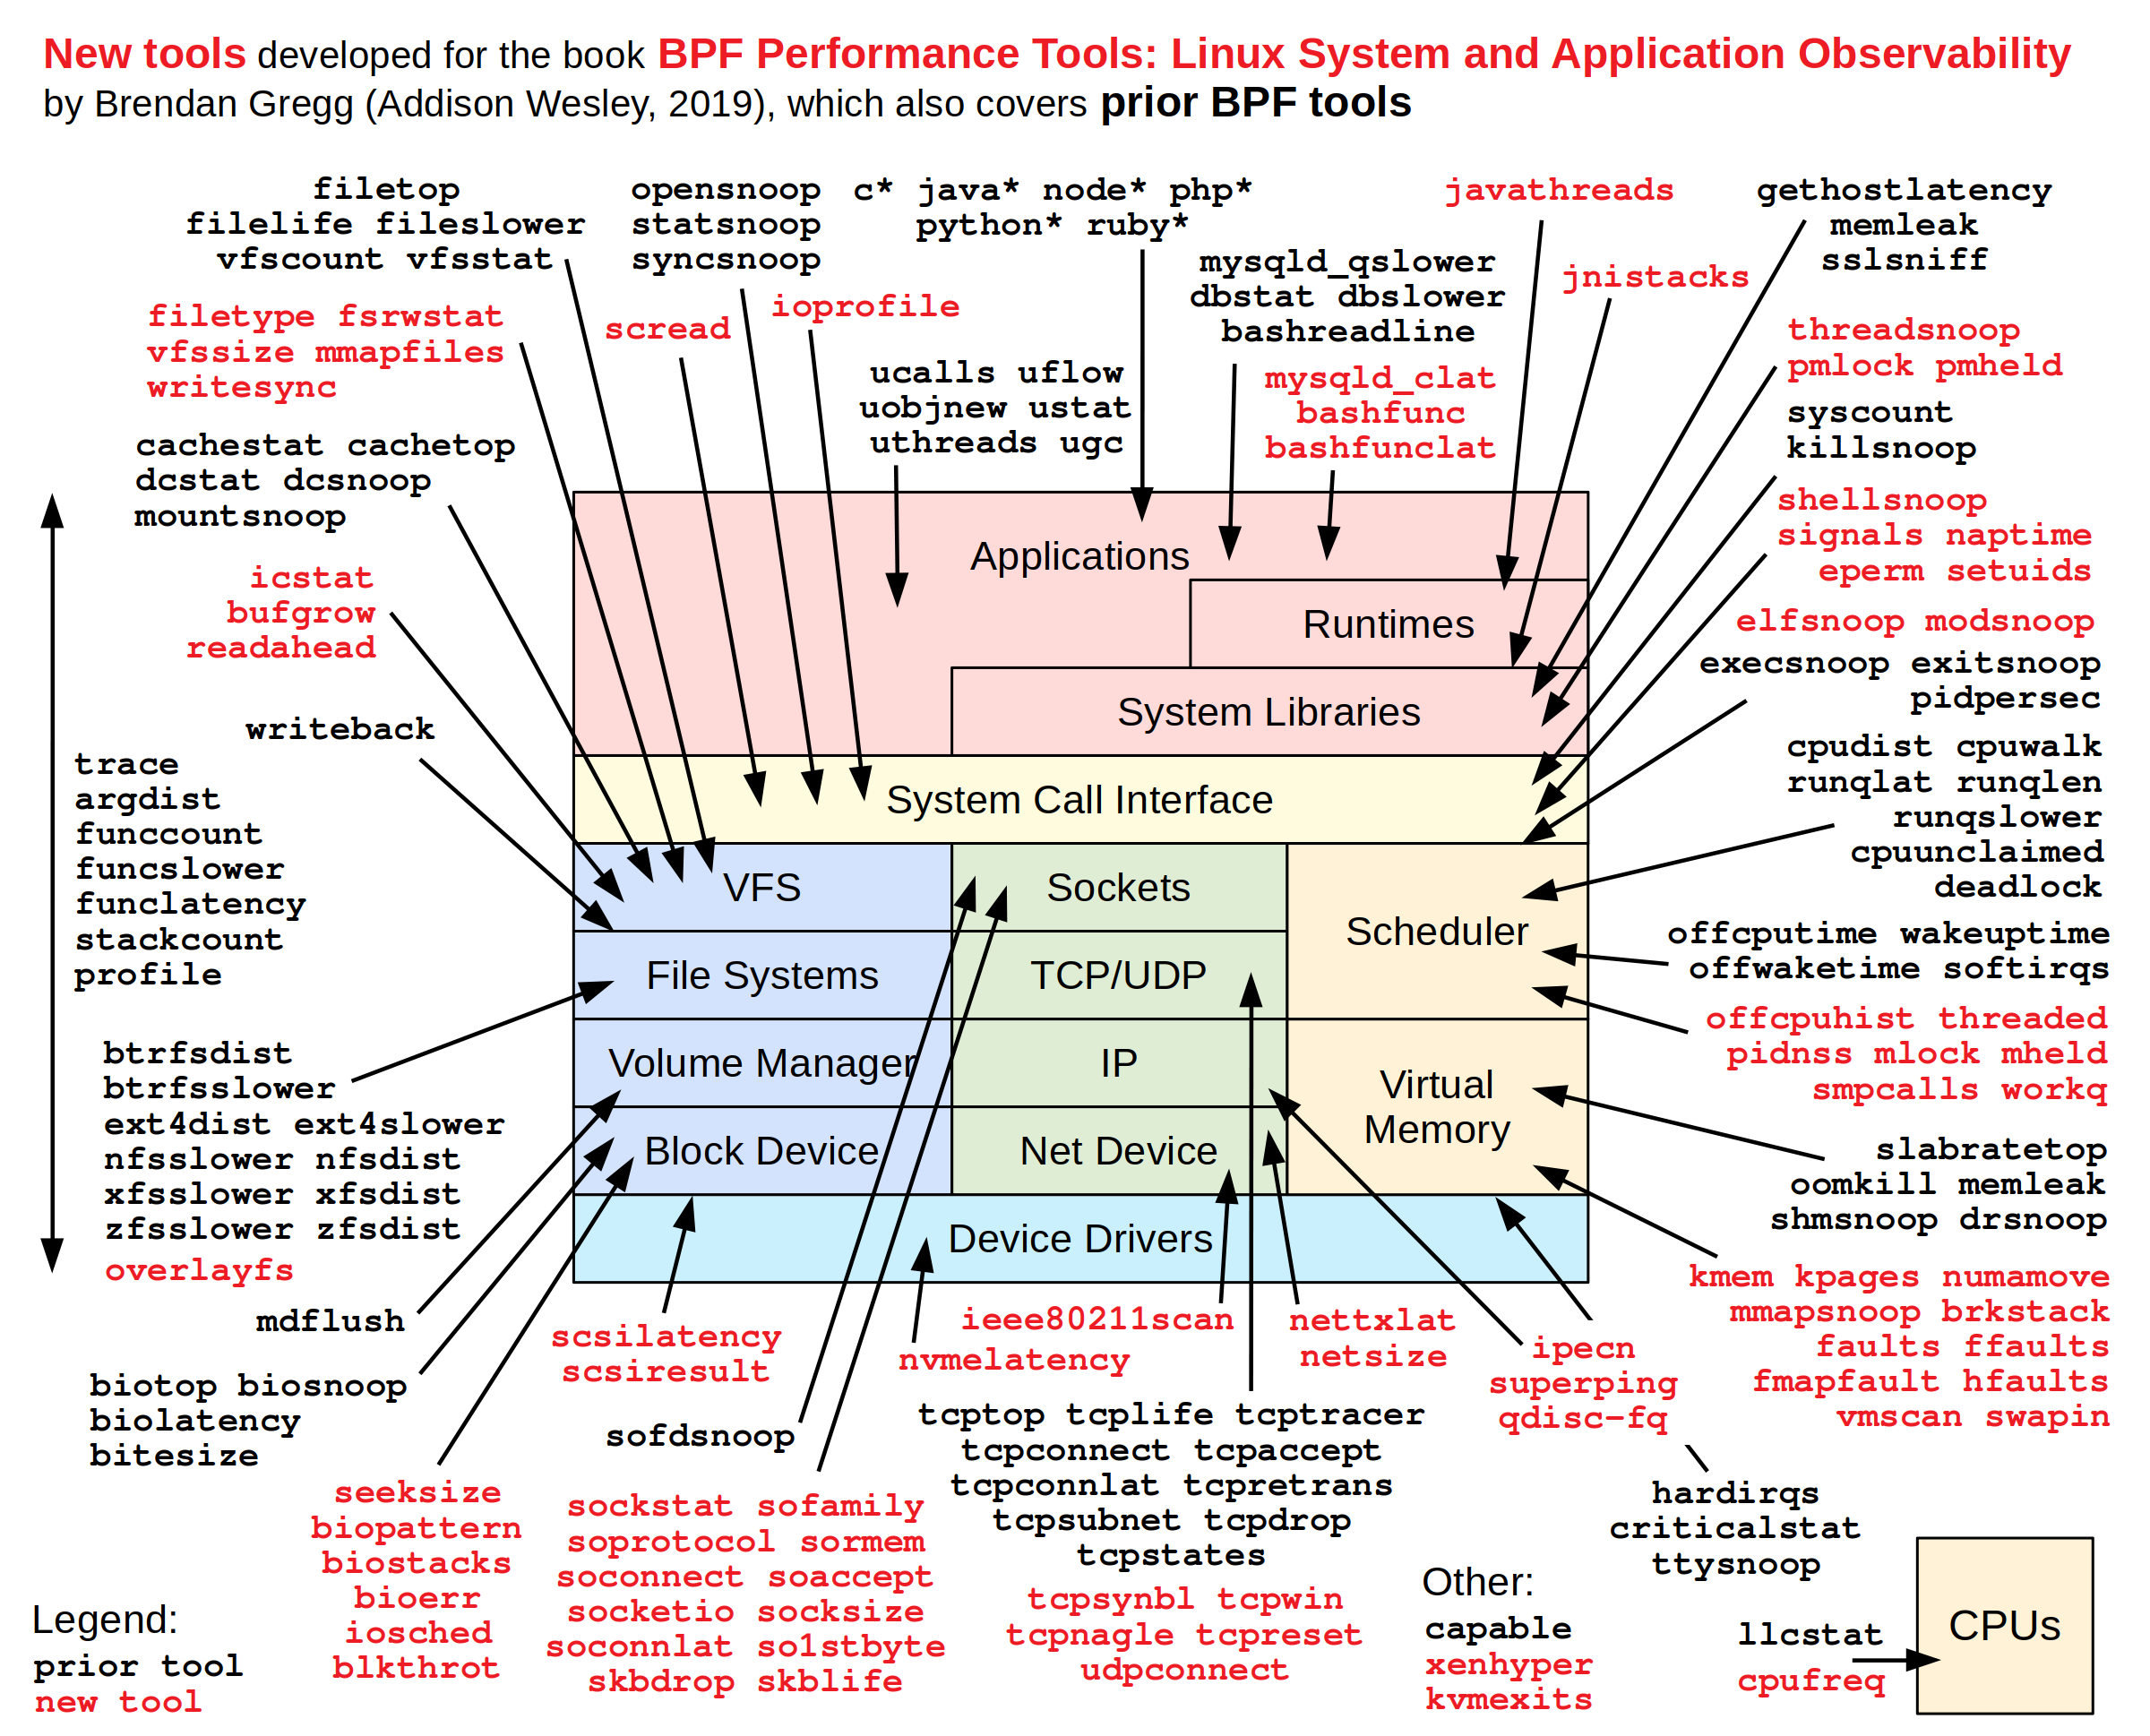
You can observe Linux systems info with BPF tools. If you have a hunch about which part of the stack has valuable info, find it on this chart and try running the corresponding commands.
@brendangregg has created a new set of BPF tools which will be available in his new book.
BPF Performance Tools by Brendan Gregg
#LISA19
These are the scenarios participants worked through in his workshop. It's super rad: https://github.com/brendangregg/bpf-perf-workshop