Open Source Web Graph - kimduho/webdev GitHub Wiki
Open Source Web Graphics Library
Gauge Components
- Open Flash Gauges
- Percentage & Dual Gauges, Value Bar, Resource Meter, Meter, Percentage Meter, Status, Temperature
- I/O Gauges, Digital Readout
- download links
- Google Charts
- Visualization - Gauge, other charts
- Dojo GFX
- a cross-browser 2D vector graphics web application API on desktop and mobile without having to deal with the browser's native graphics technologies
- chart, OpenLayers Maps, Geo Charting, gauge, etc.
- Dojo Gauge demo
- License: New BSD (Contributors License Agreement)
- jGauge JS
- a free, lightweight JS digital gauge that can be used on web based dashboards like a speedometer / fuel gauge
- License: MIT License
- JustGage
- a handy JavaScript plugin for generating and animating nice & clean gauges
- based on Raphaël library for vector drawing
- completely resolution independent & self-adjusting
- License: MIT License
- Aqua Gauge
- Windows-dll gauge project
- Gauge.js
- JavaScript/CoffeeScript, animated gauge control
- [JavaFX]
- Steel Series - Best UI representations for Gauges and LCD displays: example-1
- memefx - a set of rich, freely evolving JavaFX components (Gauge + Knob control, etc.)
- JFXtras
- a set of high quality controls and add-ons for JavaFX
- JFreeChart
- Java-based charting library: samples
Map Controls
- Polymaps
- javascript library for making dynamic, interactive maps in modern browsers
- speedy display of multi-zoom datasets over maps
- supports a variety of visual presentations of tiled vector data
- supports OpenStreetMap, CloudMade, Bing, other image-based web maps
- License: link
Web Dashboards
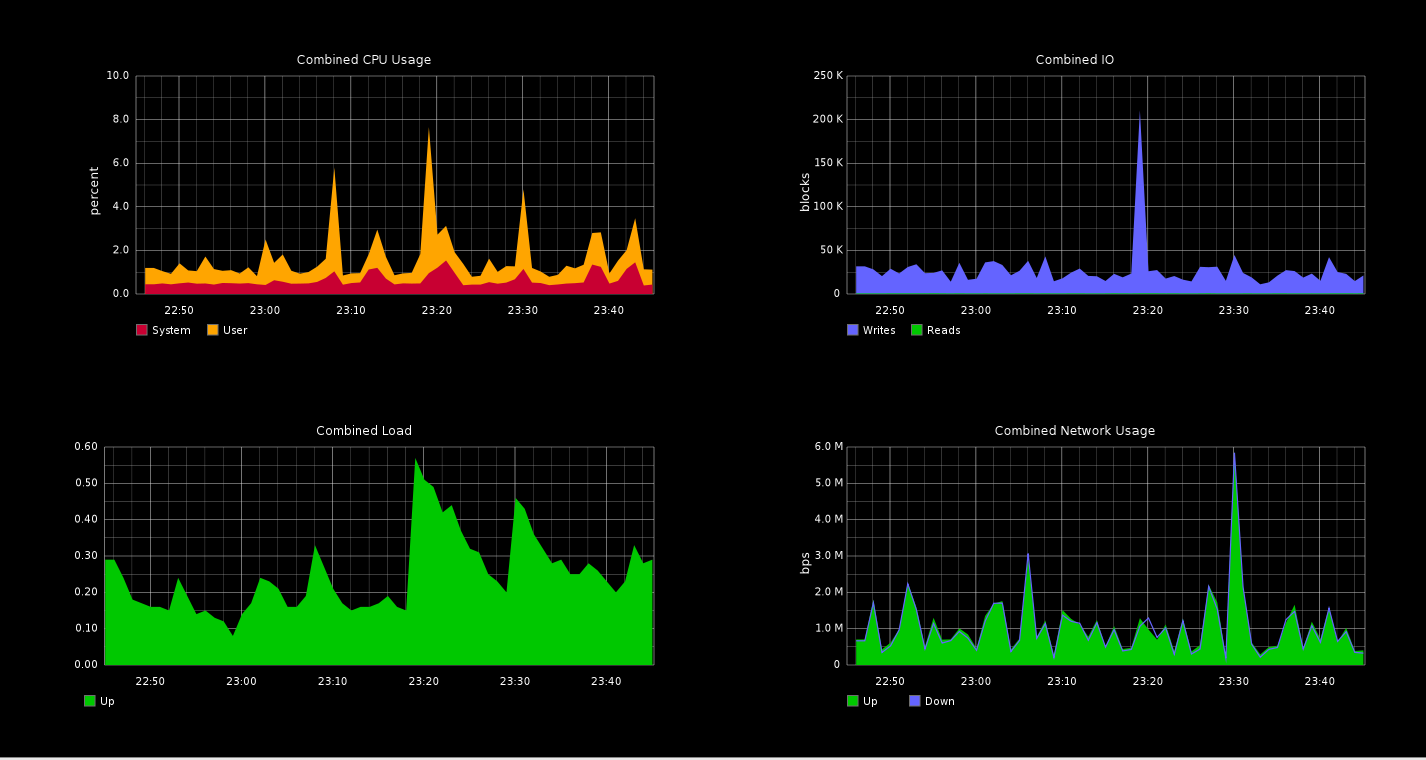
- Giraffe
- a graphite, Rickshaw-based (built on d3.js) dashboard
- demo
- License: MIT License
- Cubism.js
- Time Series Visualization
- dashboard for fitting a large number of metrics on one screen
- License: Apache License v2.0
- Graphene
- a realtime dashboard & graphing toolkit based on D3 and Backbone
- License: MIT License

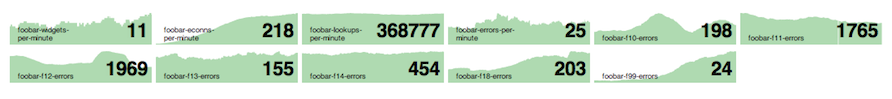
- [Tasseo]
- Rickshaw-based light-weight dashboard for viewing many different metrics
- License: 3-clause BSD License (d3.js), MIT License (Rickshaw, underscore.js)
- Graph-Explorer
- a graphite dashboard
- License: Apache License v2.0
- Vimeo.js
- Node.js library for Vimeo API
- Video Player
- License: Apache License v2.0
- DB backend Dashboard - Graphiti
- alternate JavaScript and Ruby front-end, graph storage application for the Graphite real-time graphing engine
- License: MIT License
- DB backend Dashboard - Descartes
- using Sinatra web framework under Ruby 1.9, PostgreSQL, Redis
- License: MIT License

- GDash
- a dashboard for graphite
- License: Apache License v2.0
- Dashing
- Dashboard framework based on Ruby 1.9+
- Example Dashboard
- License: MIT License
- Twitter bootstrap dashboards (?)
Etc Components
-
Area, AreaLine, Bar, BarLine, Boxplot, Candlestick, Circular, Correlation, DotLine, Dotplot
-
Genome, Heatmap, Histogram, Kaplan-Meyer, Layout, Line, Network, NonLinear-Fit, Pie
-
Scatter (2D/3D), Stacked (general/line/percent), TagCloud, Treemap, Venn, Video
-
License: GPL v3
-
a graph visualization library using web workers and jQuery
-
License: MIT License
-
Data lines, Bar chart, Sketch Bars, Area Chart, Pie Chart, Scatter Chart, etc.
-
Sequences Sunburst, Geodesic Rainbow, Streamgraph, Hive Plots, Map Projection Transitions, Bubble Chart
-
Counties Blue and Red, Reingold-Tilford Tree (Radial), Word Tree, much more
-
License: BSD License
-
Rickshaw JS
-
built on d3.js, JavaScript toolkit for creating interactive time series graphs
-
Lines & Toggling, Interactive Real-Time Data, Scatter Plot with Multiple Series
-
Stacked Bars with Deterministic Colors, Color Schemes, Interpolated Colors, Data via AJAX / JSONP
-
Fixed Window Series for Streaming Data, Scaled Series, Log and Absolute Scale, Multiple Renderers, etc.
-
License: MIT License
-
Kendo UI - $699, etc.
-
jQuery-based pretty graphs
-
License: MIT License
-
simple data-driven visualization framework
-
a set of tools to display and layout interactive graphs, along with various related algorithms
-
License: MIT License
-
javascript flow graph with drag and drop motions enabled
-
a lightweight graphics library with an intuitive graphics API and an SVG renderer
-
License: MIT License
-
a javascript library for reactive documents - for mathematical graphs, signal box, etc.
-
Tangle.js + Processing.js - explorable explanations howto - example
-
pull in media to timeline from different sources: Twitter, Flickr, Google Maps, YouTube, Vimeo, Dailymotion, Wikipedia, SoundCloud, etc.
-
display interactive static & dynamic graphs
-
License: MIT License
-
a set of software tools for creating rich interactive data visualizations
-
Prefuse flare toolkit: provides visualization and animation tools for ActionScript and the Adobe Flash Player
-
License: BSD License
-
sister project of Processing visual programming language, designed for the web
-
make data visualizations, digital art, interactive animations, educational graphs, video games, etc.
-
creates generative art using procedural graphics
-
License: GPL v2
-
vector graphics scripting framework on HTML5 canvas
-
License: MIT License
-
composes custom views of dynamic data with simple marks such as bars and dots
-
License: BSD License
Other Tools
- Mr. Data Converter
- a web application that converts data formats
- e.g.) comma --> xml, json, html, php, mysql, python, ruby, etc.