Mandelbrot Set Python Code with numpy and matplotlib - joshadamsPHYS300/2017-cmp GitHub Wiki
Named after its discoverer, French mathematician Mandelbrot, the Mandelbrot set is a fractal, an infinitely ramified mathematical object that contains structure within structure within structure, as deep as we care to look.
The definition of the Mandelbrot set is in terms of complex numbers as follows. Consider the equation
z′ = z2 + c
where z is a complex number and c is a complex constant. For any given value of c this equation turns an input number z into an output number z′.
The definition of the Mandelbrot set involves the repeated iteration of this equation, where we take an initial starting value of z and feed it into the equation to get a new value z′. We then take that value and feed it in again to get another value, and so on.
The Mandelbrot Set is the set of points in the complex plane that satisfy the following definition:
For a given complex value of c, start with z = 0 and iterate repeatedly. If the magnitude |z| of the resulting value is ever greater than 2, then the point in the complex plane at position c is not in the Mandelbrot set, otherwise it is in the set.
In order to use this definition, one would have to iterate infinitely many times to prove that a point is in the Mandelbrot set, since a point is in the set only if the iteration never passes |z| = 2. In practice; however, one usually just performs some large number of iterations, and if |z| has not exceeded 2 by that point then, we call the result good enough.
To make an image of the Mandelbrot set in Python, we perform the iteration for all values of c = x + iy on an N x N grid spanning the region where −2 ≤ x ≤ 2 and −2 ≤ y ≤ 2, and make a density plot. Although there are a variety of ways to approach this task in Python, below are two very different examples of the Mandelbrot set.
Example 1:
import numpy as np
from matplotlib import pyplot as plt
from matplotlib import colors
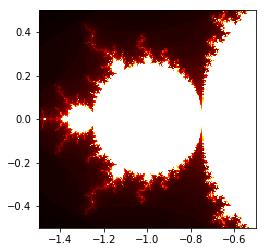
x = np.linspace(-1.5,-.5,200)
y = np.linspace(-.5,.5,200)
c = np.empty((200,200), complex)
z = 0
mandelb_set = np.empty((200,200),int)
for it in range(200):
for i in range(200):
c[it,i] = x[i] + 1j*y[it]
z = 0
for k in range(100):
z = z**2 + c[it,i]
mandelb_set[it,i] = 100
if np.absolute(z) >=2:
mandelb_set[it,i] = k + 1
break
plt.imshow(mandelb_set,extent=[x[0],x[-1],y[0],y[-1]],cmap='hot')
plt.show()
Example 2:
   import numpy as np
from matplotlib import colors, pyplot
import timeit

xmin, xmax, xn = -2.0, +2.0, 1000
ymin, ymax, yn = -2.0, +2.0, 1000
maxN = 200
horizon = 2
def mandelbrot_set(xmin, xmax, ymin, ymax, xn, yn, maxN, horizon=2.0):
    X = np.linspace(xmin, xmax, xn, dtype=np.float32)
    Y = np.linspace(ymin, ymax, yn, dtype=np.float32)
    C = X + Y[:, None]*1j
    N = np.zeros(C.shape, dtype=int)
    Z = np.zeros(C.shape, np.complex64)
    for n in range(maxN):
        I = np.less(abs(Z), horizon)
        N[I] = n
        Z[I] = Z[I]**2 + C[I]
    N[N == maxN-1] = 0
    return Z, N

if __name__ == '__main__':
    start = timeit.default_timer()
    log_horizon = np.log(np.log(horizon))/np.log(2)
    Z, N = mandelbrot_set(xmin, xmax, ymin, ymax, xn, yn, maxN, horizon)

    with np.errstate(invalid='ignore'):
        M = np.nan_to_num(N + 1 - np.log(np.log(abs(Z)))/np.log(2) + log_horizon)

    dpi = 150
    width = 10
    height = 10
    fig = plt.figure(figsize=(width, height), dpi=dpi)
    ax = fig.add_axes([0.0, 0.0, 1.0, 1.0], frameon=False, aspect=1)

    light = colors.LightSource(azdeg=90, altdeg=90)
    M = light.shade(M, cmap=plt.cm.hot, vert_exag=1.5,
                    norm=colors.PowerNorm(.2))
    plt.imshow(M, extent=[xmin, xmax, ymin, ymax])
    ax.set_xticks([])
    ax.set_yticks([])

    plt.show()
    stop = timeit.default_timer()
    print(stop - start)