Flowcharting Notes - johnfraserss/ICS2O9 GitHub Wiki
When going through a design phase (and sometimes an analysis phase) in the Software Development Life Cycle, most programmers will plan out their program using flowcharts. As this is just an introduction to the idea of flowcharting, there are only certain symbols that will be used in this course.
There are a variety of symbols used in flowcharting, but as noted only 4 will be used by our classes.
This shape tells you where the flowchart begins and ends. It shows the entry point of your flowchart and the exit point. To designate the start of your flowchart, you would fill this shape with words like Start or Begin. The words you use are up to you.

To designate the ending point of the chart, this shape is filled with words like End, Exit, or Return.

Usually a flowchart has one starting point. However, a flowchart can have as many ending points as needed. Sometimes you see this shape drawn as an oval as shown below. That is fine.
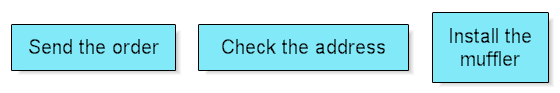
In most flowcharts, the rectangle is the most common shape. It is used to show a process, task, action, or operation. It shows something that has to be done or an action that has to be taken. The text in the rectangle almost always includes a verb.
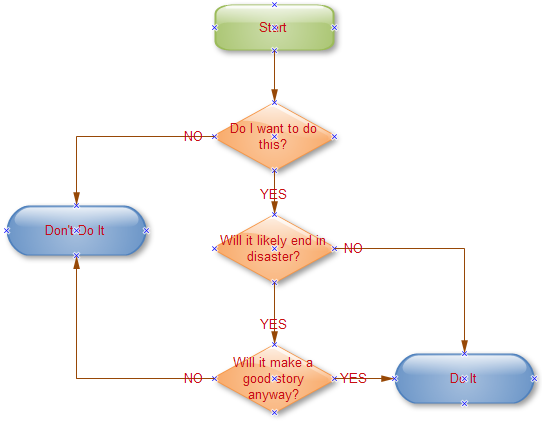
A decision asks a question. The answer to the question determines which arrow you follow out of the decision shape. For example, in the shape below, if it is cloudy, you follow the arrow down near the word Yes. If it is not cloudy, you follow the arrow to the right near the word No.
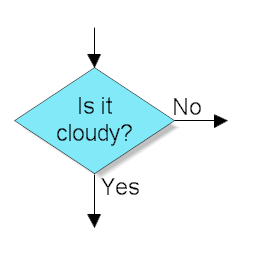
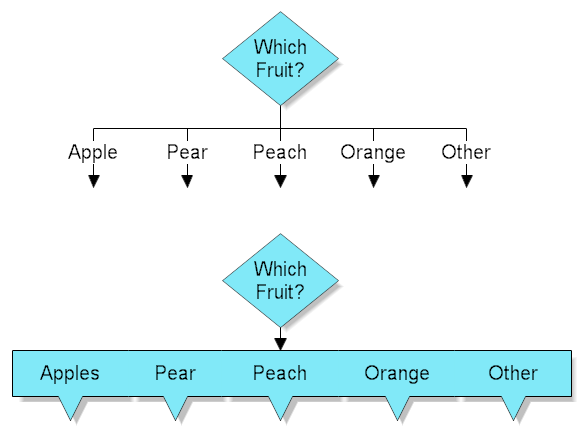
The arrows flowing from the decision shape are usually labeled with Yes, No or True, False. But you can label them any way you want as long as the meaning is clear. This shape has one input arrow. It is usually at the top, but can be on any corner. The decision shape can have two or three exit points. If you need more than 3 exit points, then you can use either of the methods shown below.
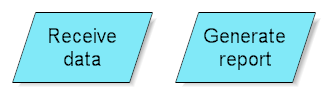
A parallelogram is used to show input or output. Examples of input are receiving a report, getting an e-mail, getting an order, receiving data in some format, etc. Examples of output are generating a report, sending an e-mail, faxing a message, etc.
Check out the following links for some sample flowcharts:
-
Sample 1
http://upload.wikimedia.org/wikipedia/commons/thumb/9/91/LampFlowchart.svg/500px-LampFlowchart.svg.png -
Sample 2
http://www.farshadoo.com/p/diagram-ring/images/diagram-sample1.jpg -
Sample 3
http://www.edrawsoft.com/images/examples/makeflowchart.png
[1] All information on symbols was taken directly from: http://www.rff.com/flowchart_shapes.htm (Retrieved: Feb 7, 2013)