Point Graph - jjoe64/GraphView GitHub Wiki
To plot a points diagram with GraphView you have to use the PointsGraphSeries class. This has some predefined drawings, and you have to opportunity to use a custom rendering.
Options:
-
setShape
Here you define the drawing that will be used for the data points. You can use Shape.POINT, Shape.TRIANGLE, Shape.RECTANGLE. By default the point is used.
-
setSize
This defines the size of the shape.
-
setCustomShape
You can implement a custom rendering method. This will be called for every data point with the x/y coordinates. You have to take care, that you paint your drawing at that point. You have also take care about the color and the size.
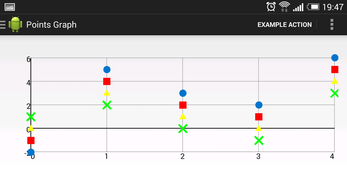
Here is an example with the different shapes and a custom shape:
GraphView graph = (GraphView) findViewById(R.id.graph);
PointsGraphSeries<DataPoint> series = new PointsGraphSeries<>(new DataPoint[] {
    new DataPoint(0, -2),
    new DataPoint(1, 5),
    new DataPoint(2, 3),
    new DataPoint(3, 2),
    new DataPoint(4, 6)
});
graph.addSeries(series);
series.setShape(PointsGraphSeries.Shape.POINT);

PointsGraphSeries<DataPoint> series2 = new PointsGraphSeries<DataPoint>(new DataPoint[] {
    new DataPoint(0, -1),
    new DataPoint(1, 4),
    new DataPoint(2, 2),
    new DataPoint(3, 1),
    new DataPoint(4, 5)
});
graph.addSeries(series2);
series2.setShape(PointsGraphSeries.Shape.RECTANGLE);
series2.setColor(Color.RED);

PointsGraphSeries<DataPoint> series3 = new PointsGraphSeries<>(new DataPoint[] {
    new DataPoint(0, 0),
    new DataPoint(1, 3),
    new DataPoint(2, 1),
    new DataPoint(3, 0),
    new DataPoint(4, 4)
});
graph.addSeries(series3);
series3.setShape(PointsGraphSeries.Shape.TRIANGLE);
series3.setColor(Color.YELLOW);

PointsGraphSeries<DataPoint> series4 = new PointsGraphSeries<>(new DataPoint[] {
    new DataPoint(0, 1),
    new DataPoint(1, 2),
    new DataPoint(2, 0),
    new DataPoint(3, -1),
    new DataPoint(4, 3)
});
graph.addSeries(series4);
series4.setColor(Color.GREEN);
series4.setCustomShape(new PointsGraphSeries.CustomShape() {
    @Override
    public void draw(Canvas canvas, Paint paint, float x, float y, DataPointInterface dataPoint) {
    paint.setStrokeWidth(10);
    canvas.drawLine(x-20, y-20, x+20, y+20, paint);
    canvas.drawLine(x+20, y-20, x-20, y+20, paint);
    }
});