Bar Graph - jjoe64/GraphView GitHub Wiki
To plot a Bar Diagram with Graph View you have to use the class BarGraphSeries. The bars will have its origin at the zero-line. So if you have negative y-values, the bars will be inverted. It is important that the data you're using is in a regular interval (x) and without holes, because for every data point there will be a single bar.
There are some styling options:
-
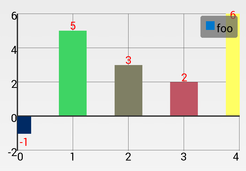
Values on top
The y-values of a single bar can be displayed above the bar. You can specify the color and text size. Use
barGraphSeries.setDrawValuesOnTop() -
Value dependent color
You can implement a hook that let you define the color of the bars in dependence of the y-value. Use
barGraphSeries.setValueDependentColor() -
Spacing
If you do not want that the bars fill the complete viewport, you can define a spacing between the bars in percentage.
Here is an example with the styling options:
GraphView graph = (GraphView) findViewById(R.id.graph);
BarGraphSeries<DataPoint> series = new BarGraphSeries<>(new DataPoint[] {
    new DataPoint(0, -1),
    new DataPoint(1, 5),
    new DataPoint(2, 3),
    new DataPoint(3, 2),
    new DataPoint(4, 6)
});
graph.addSeries(series);

// styling
series.setValueDependentColor(new ValueDependentColor<DataPoint>() {
    @Override
    public int get(DataPoint data) {
    return Color.rgb((int) data.getX()*255/4, (int) Math.abs(data.getY()*255/6), 100);
    }
});

series.setSpacing(50);

// draw values on top
series.setDrawValuesOnTop(true);
series.setValuesOnTopColor(Color.RED);
//series.setValuesOnTopSize(50);