Google Analytics - jhudsl/OTTR_Template GitHub Wiki
If you would like to add Google Analytics to track traffic to your course, you can do the following:
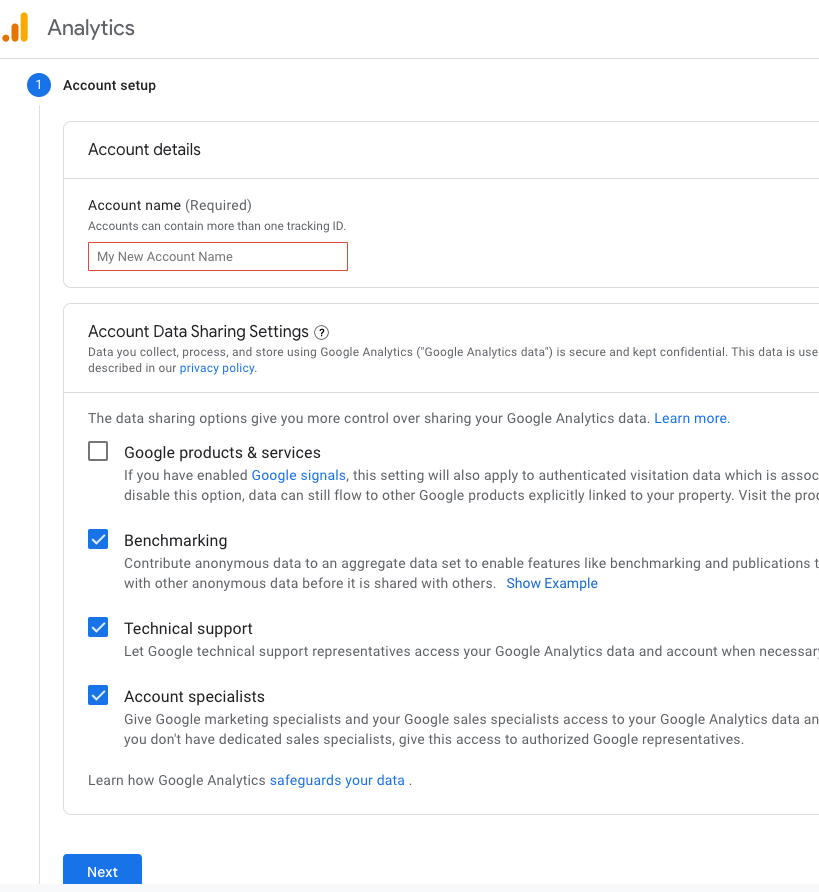
- Get a Google Analytics account (if you do not already have one): https://analytics.google.com/analytics
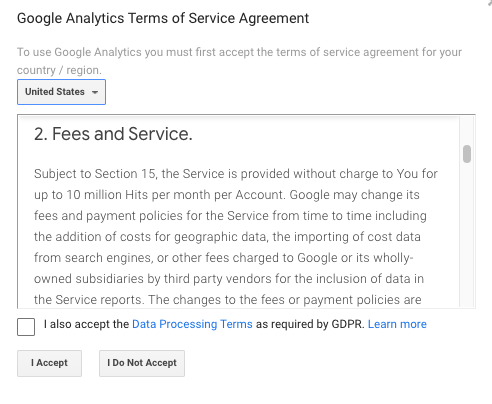
Note that in creating an account you will need to agree to some terms. Currently it is free to get Google analytics data as long as your course does not exceed a very high user rate. Check to make sure that the terms work for you
-
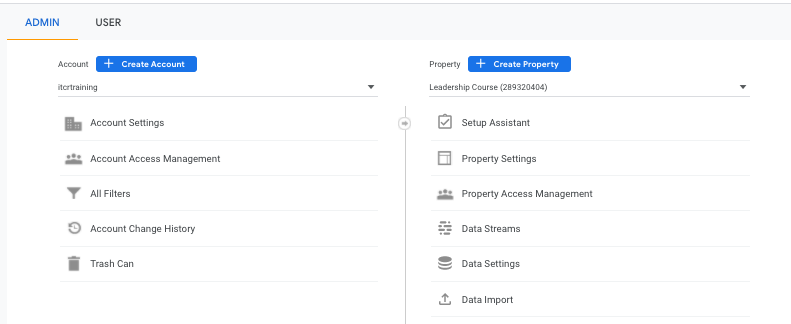
If you already have an account or navigated away from where you started - Go to the Admin tab (lower left button that looks like a gear)
-
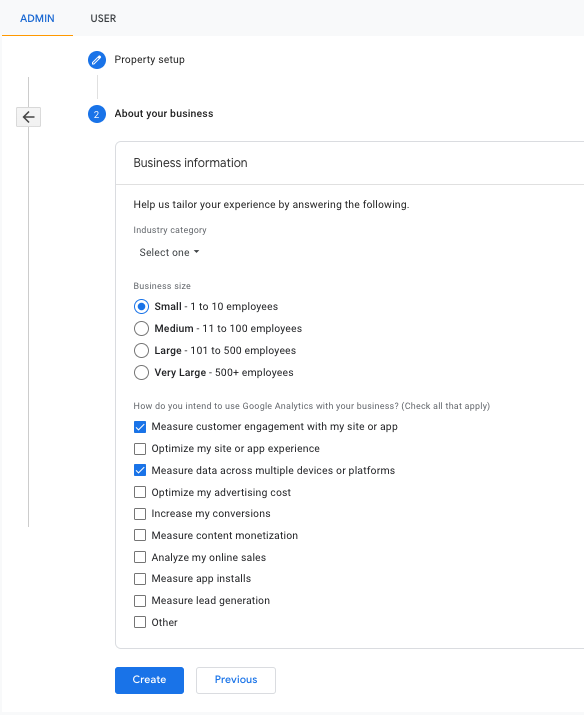
Set up a new property (fill out name and details, select options about tracking traffic for how you intend to use Google Analytics)
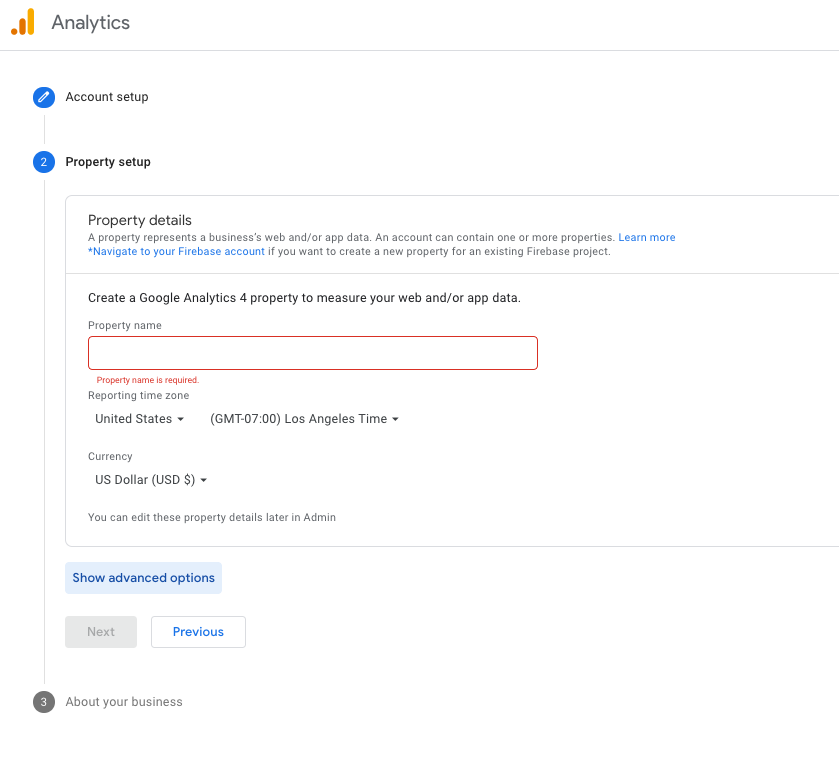
- Add a stream to your property, choose the Web option.

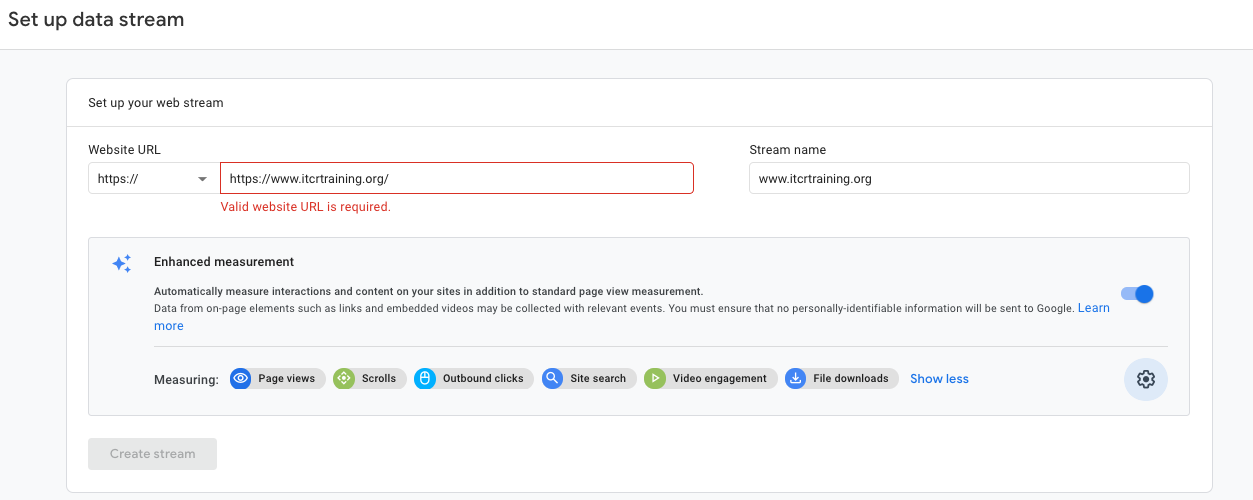
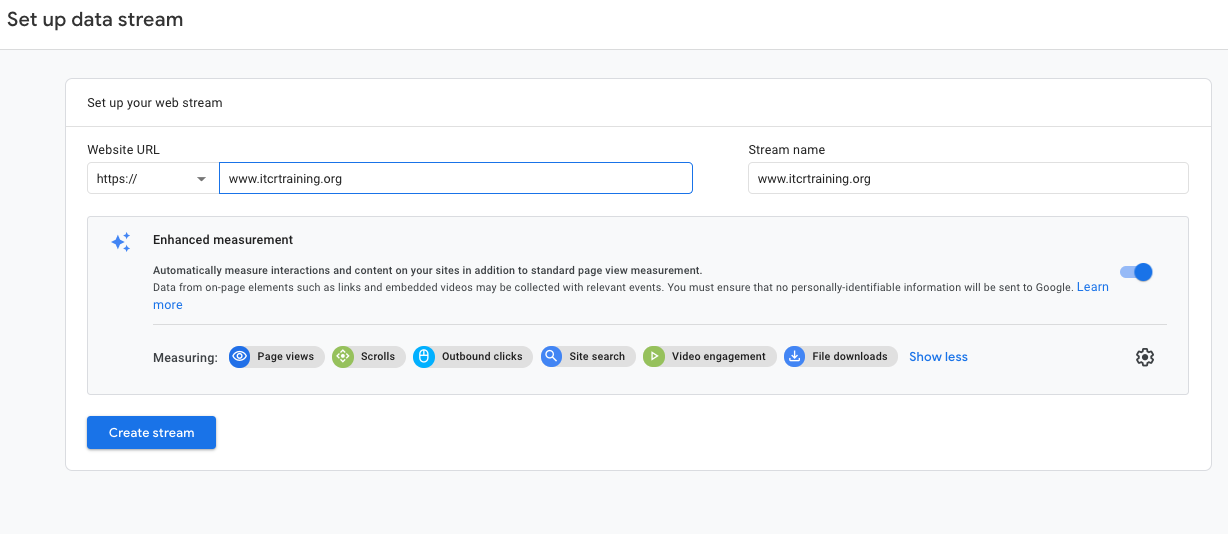
- Fill in your stream information with the link for your course (note you may need to remove https as this is part of a pull down menu to the left of where you paste your link)
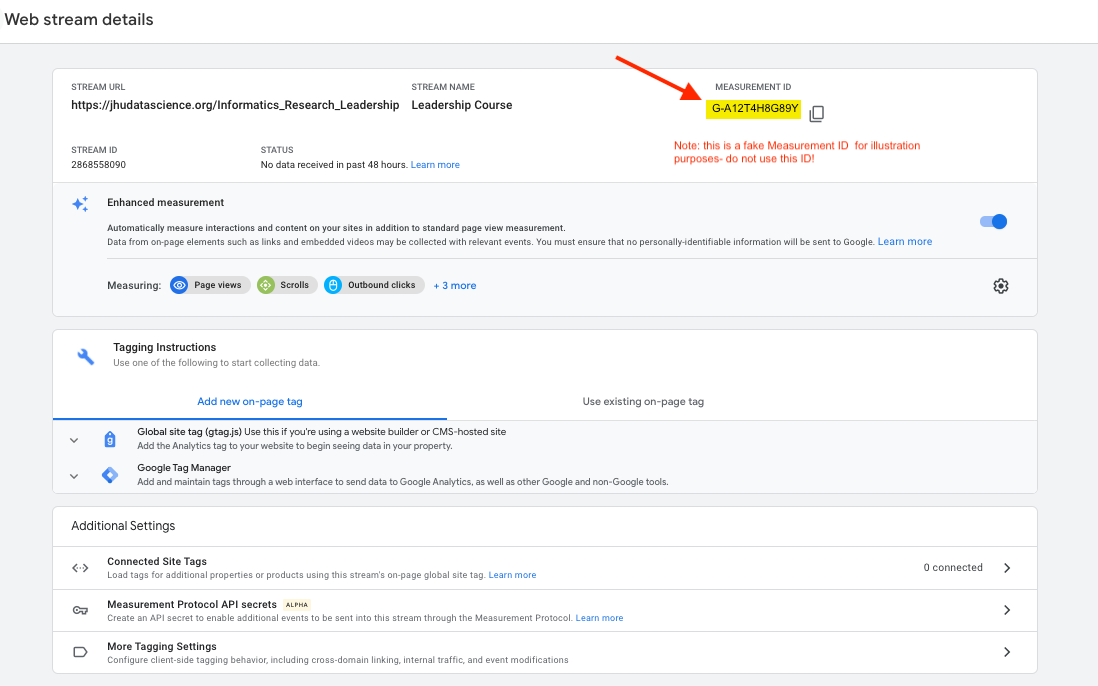
- On the resulting page you will see a Measurement ID. Copy this ID and paste it in the GA_Script.Rhtml file in the template replacing the fields that say {MeasurementID} including the curly brackets.
-
Modify the _output.yml file so that the line that starts with
before body:is changed to include brackets around the GA_script.Rhtml file before a comma and the name of the hero image html file (which should already be listed). For example, like this:before_body: [GA_Script.Rhtml, assets/big-image-itcr.html]or this:before_body: [GA_Script.Rhtml, assets/big-image.html] -
Rerender your course by making a change to one of your chapter RMD files in a pull request and pushing and merging the pull request. This will cause new html files to be made for each chapter in the
docsfolder. The Google Analytics code should now be in each of the html files - you can check by searching forGoogle Analytics. -
Go back to Google Analytics and log in if you need to.
-
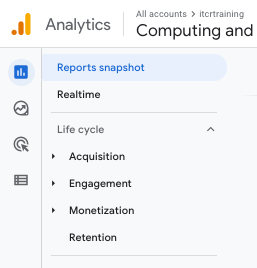
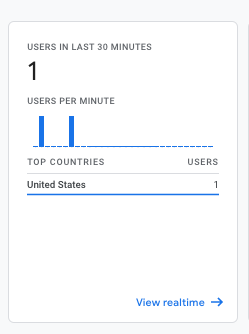
Check on the Reports button on the top of the far left icon menu. The icon looks like a bar chart. If you open up a browser window to your hosted course online, then you should see yourself as 1 user in the last 30 minutes.
- Enjoy the data about how people are using your course!