3) Prometheus Operator for Beginner - jangjaelee/tutorials-prometheus GitHub Wiki
2022.06. 이장재 📧 [email protected] 📂 https://github.com/jangjaelee 📒 http://www.awx.kr
Prometheus Operator는 Prometheus 기반 Kubernetes 모니터링 스택을 관리하기 위하여 Kubernetes Operator 패턴을 구현한 것 입니다. Kubernetes Operator는 Kubernetes에서 특정 서비스의 실행을 관리 및 구현 세부 정보를 추상화하기 위해 Kubernetes custom resource와 controller code로 구성 됩니다.
Prometheus Operator의 주요 목적은 Kubernetes 클러스터에서 실행되는 Prometheus 모니터링 스택의 구성 및 관리를 단순화하고 자동화하는 것이며, Kubernetes CustomResourceDefinitions(CRDs)를 통해 Prometheus, Alertmanager 및 기타 구성 요소를 쉽게 사용자 지정할 수 있습니다.
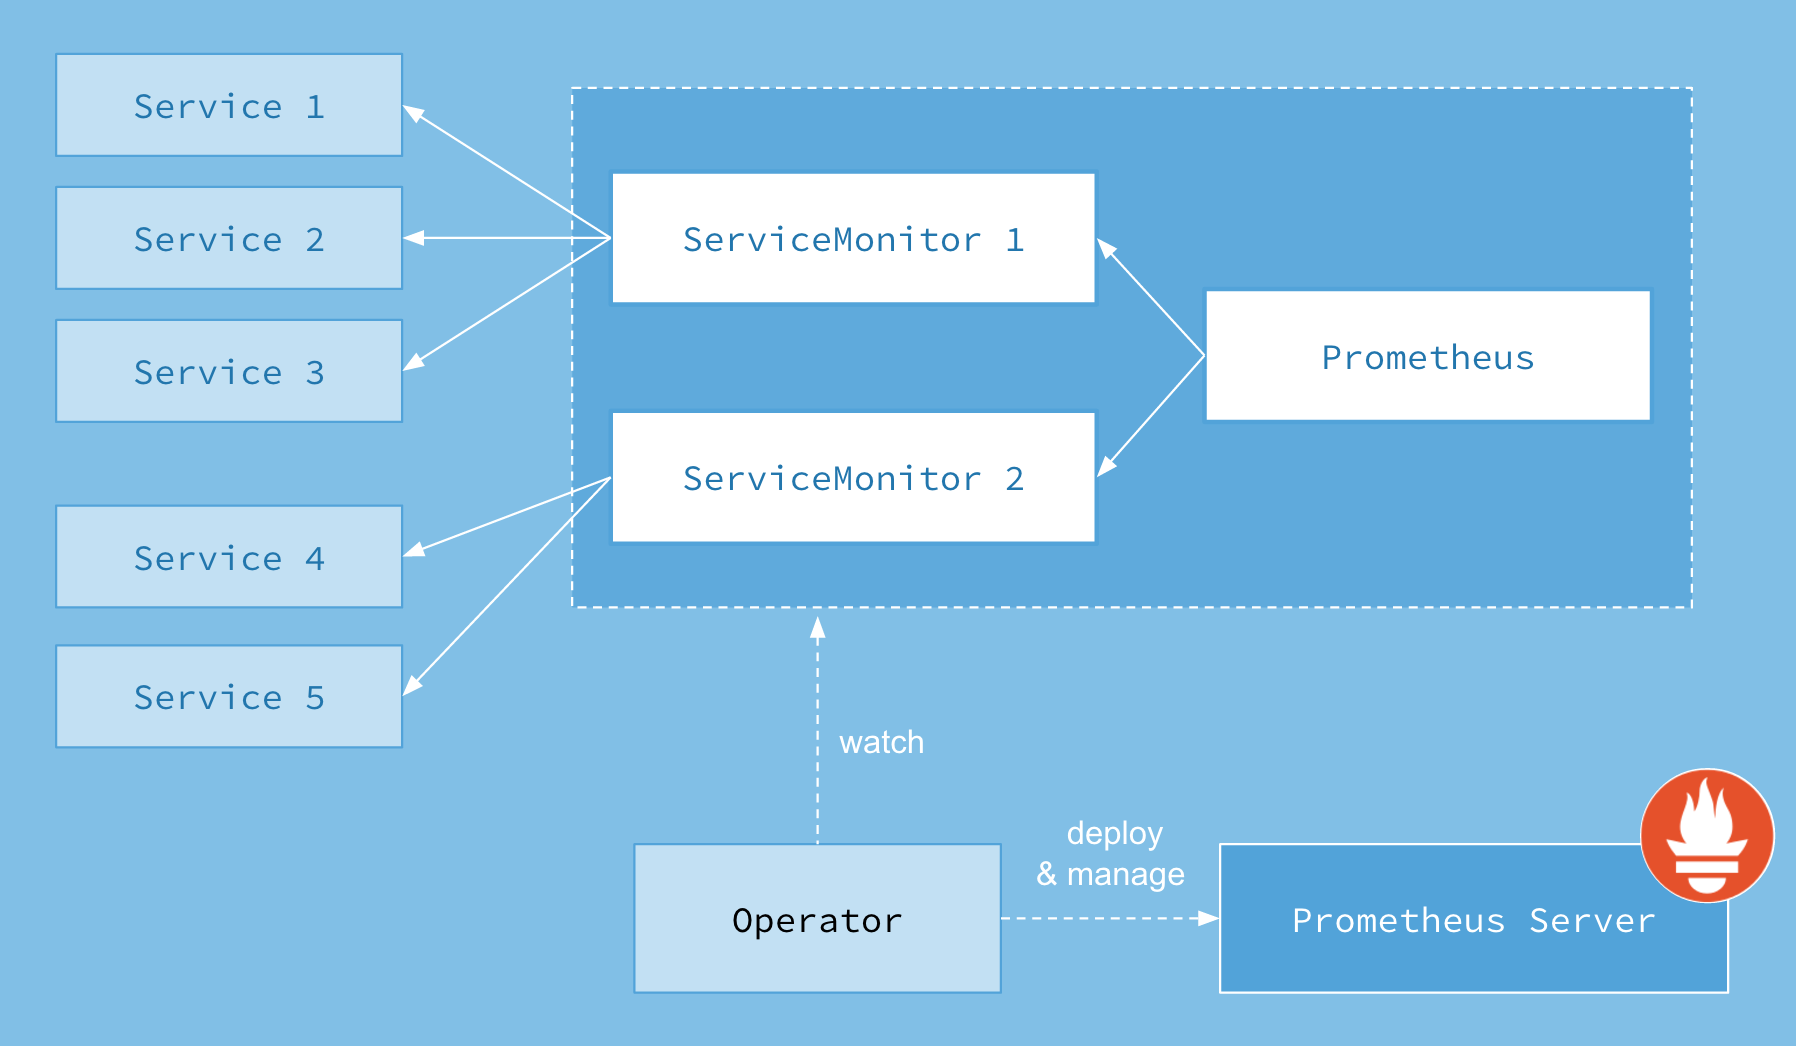
예를 들어 ServiceMonitor custom resource를 사용하여 YAML manifest에서 Kubernetes 서비스 그룹을 모니터링하는 방법을 구성할 수 있으며, Operator controller는 K8s API 서버와 통신하여 Service endpoints을 모니터링하고 구성된 서비스에 필요한 Prometheus scrape 구성을 자동으로 생성 합니다.
Prometheus Operator의 주요 특징은 다음과 같습니다.
- Kubernetes Custom Resources: Use Kubernetes custom resources to deploy and manage Prometheus, Alertmanager, and related components.
- Simplified Deployment Configuration: Configure the fundamentals of Prometheus like versions, persistence, retention policies, and replicas from a native Kubernetes resource.
- Prometheus Target Configuration: Automatically generate monitoring target configurations based on familiar Kubernetes label queries; no need to learn a Prometheus specific configuration language.
Prometheus Operator를 설치 방법을 알아보고 Prometheus 모니터링 스택을 구성하고 있는 Prometheus Operator의 custom resources에는 어떤 것들이 있는지 그리고 custom resource의 YAML Example를 살펴 보겠습니다.
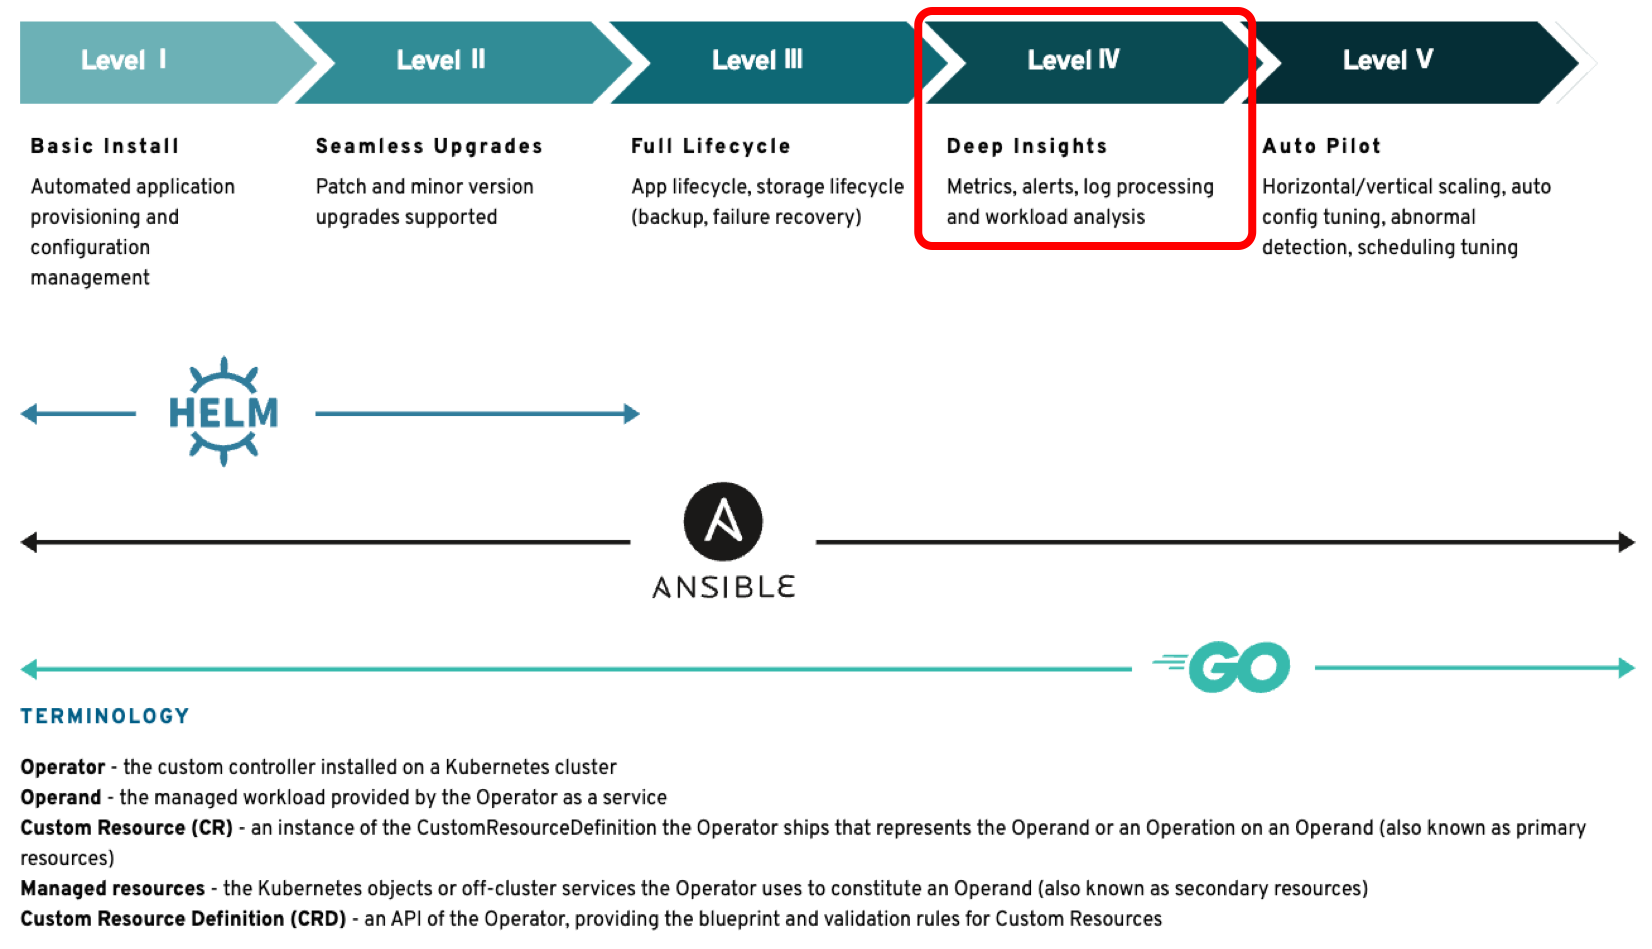
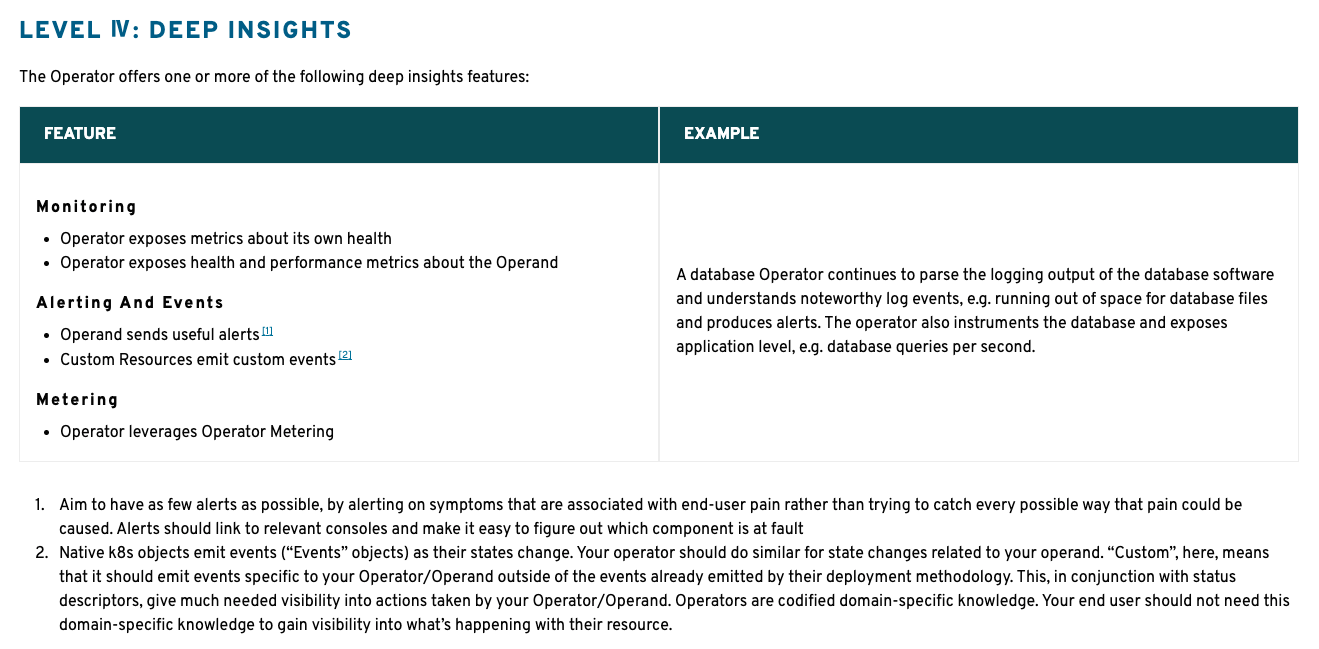
Prometheus Operator는 성숙도 수준이 Level IV로 깊은 통찰력(Deep Insights) 수준을 제공합니다.
Operator Capability Levels 각 단계에 대한 자세한 설명은 [링크]를 참조하세요.

[출처] https://www.nicktriller.com/blog/managing-prometheus-on-kubernetes-with-prometheus-operator/
[출처] https://www.youtube.com/watch?v=Uph_Say4D3M
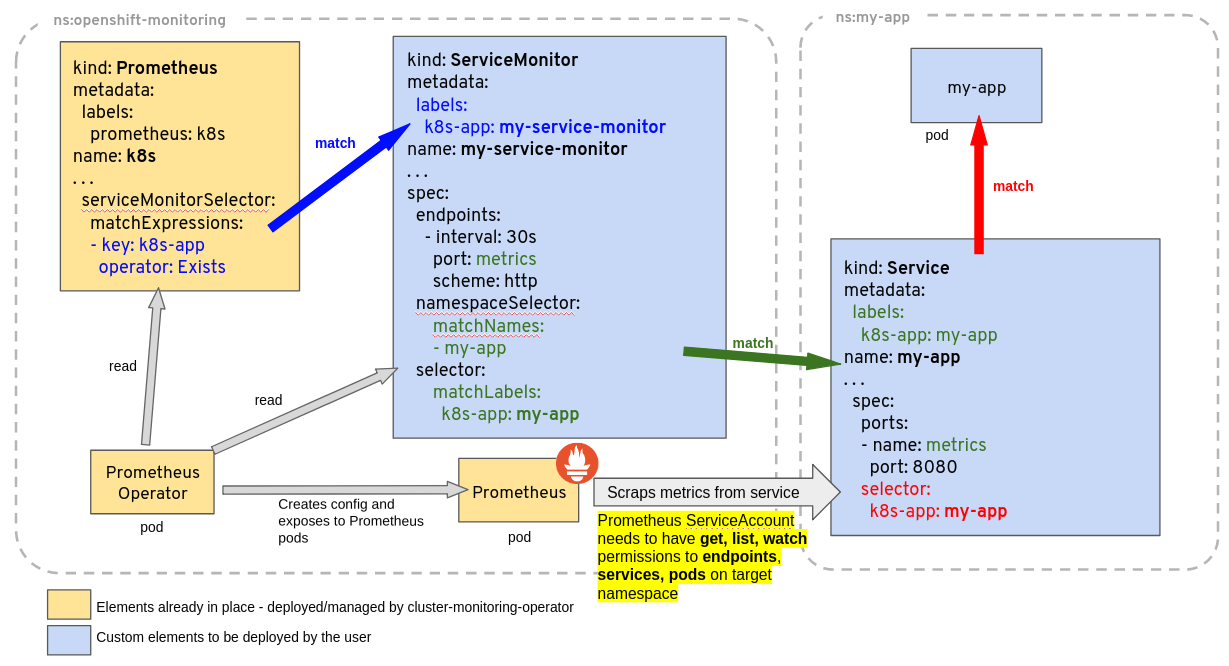
[출처] https://prometheus-operator.dev/docs/operator/troubleshooting/custom-metrics-elements.png
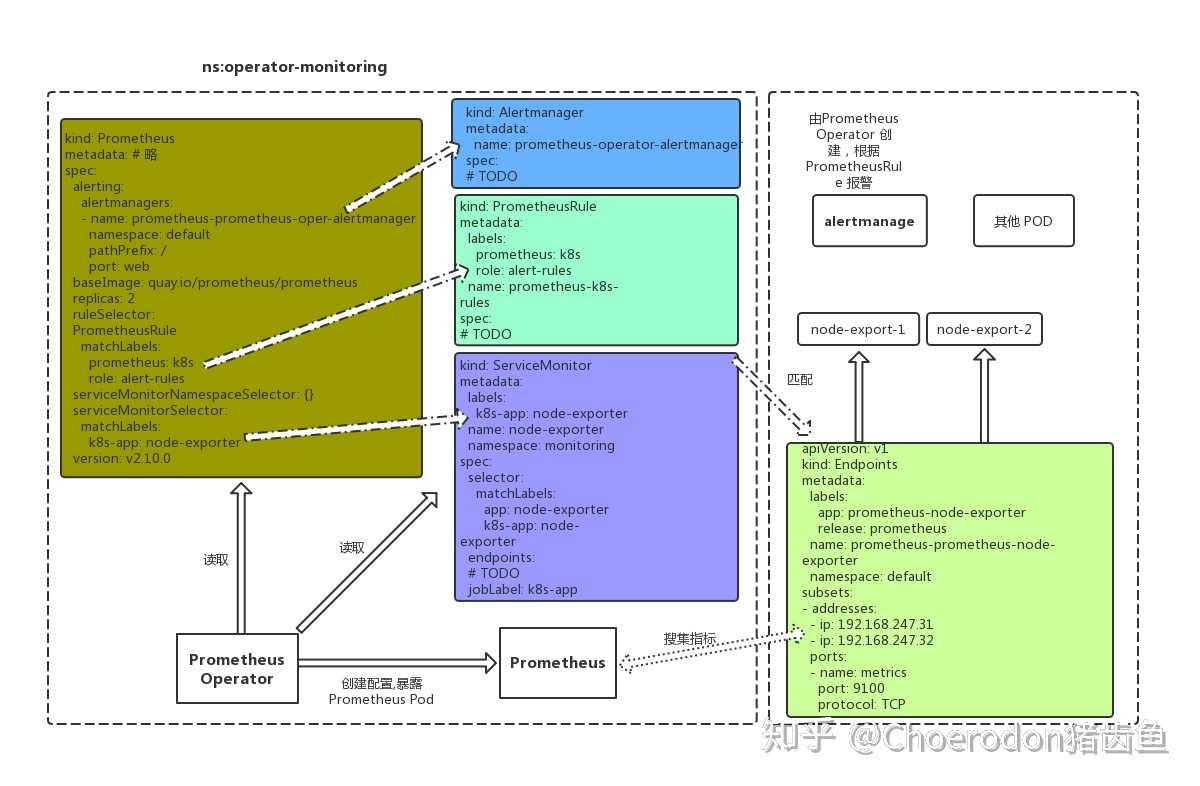
[출처] https://zhuanlan.zhihu.com/p/76835425
[출처] https://www.youtube.com/watch?v=Uph_Say4D3M
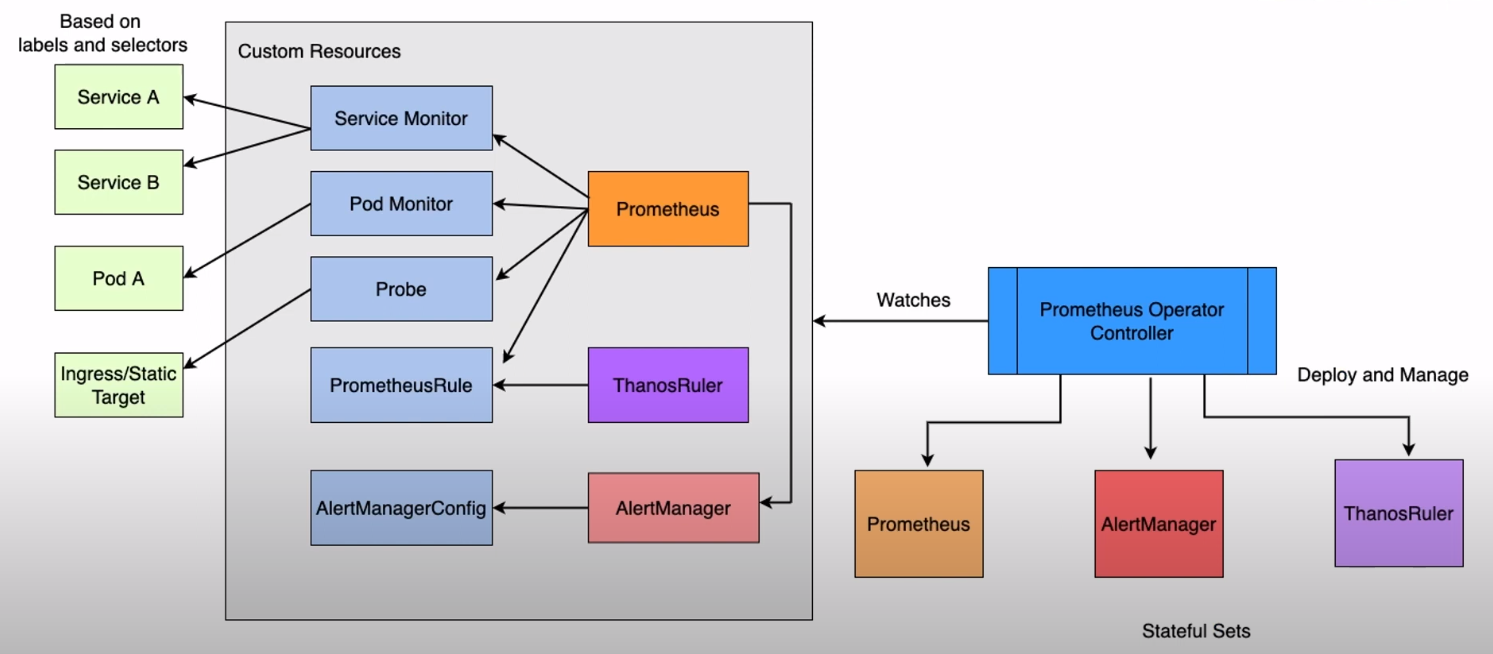
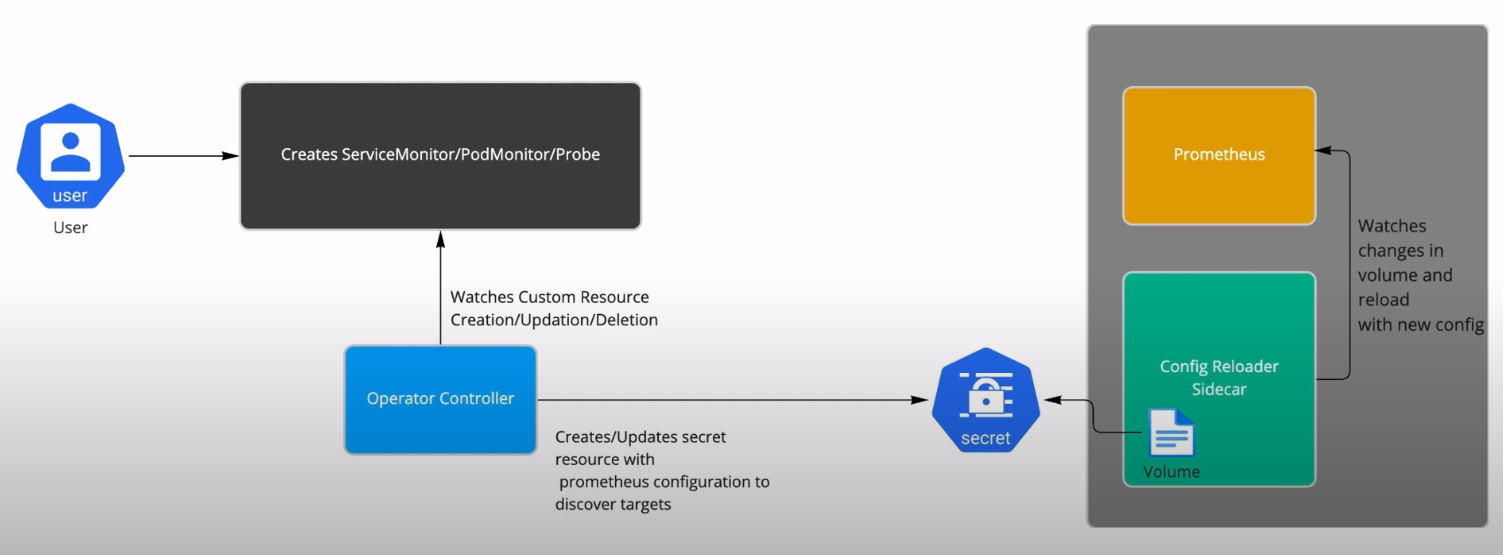
Prometheus Operator의 핵심 기능으로 Kubernetes API 서버에서 특정 개체의 변경 사항을 모니터링을 통해 개체의 변경 사항을 감지하고 개체가 선언상태와 일치하는지 확인하며, CRD를 사용하여 작동 합니다.
-
Prometheus : 프로메테우스 배포를 StatefulSet으로 정의
apiVersion: monitoring.coreos.com/v1
kind: Prometheus
metadata:
  name: example
  namespace: monitoring
spec:
  replicas: 2
  serviceAccountName: prometheus-k8s
  serviceMonitorSelector: {}
  ruleSelector: {}
  podMonitorSelector: {}
  probeSelector: {}
  alerting:
    alertmanagers:
      - namespace: monitoring
        name: alertmanager-main
        port: web
-
Alertmanager : Alertmanager 배포를 정의
apiVersion: monitoring.coreos.com/v1
kind: Alertmanager
metadata:
  name: alertmanager-main
  namespace: monitoring
spec:
  replicas: 3
  alertmanagerConfigSelector: {}
-
ThanosRuler : ThanosRuler 배포와 설정을 선언적으로 정의 - Thanos Rule [링크]
apiVersion: monitoring.coreos.com/v1
kind: ThanosRuler
metadata:
  name: thanos-ruler-demo
  labels:
    example: thanos-ruler
  namespace: monitoring
spec:
  image: quay.io/thanos/thanos
  ruleSelector:
    matchLabels:
      role: my-thanos-rules
  queryEndpoints:
    - dnssrv+_http._tcp.my-thanos-querier.monitoring.svc.cluster.local
-
ServiceMonitor : Kubernetes 서비스 그룹을 모니터링하는 방법을 선언적으로 지정
apiVersion: monitoring.coreos.com/v1
kind: ServiceMonitor
metadata:
  name: example
  namespace: monitoring
spec:
  selector:
    matchLabels:
      operated-prometheus: 'true'
  endpoints:
    - port: web
      interval: 30s
-
PodMonitor : Pod 그룹을 모니터링하는 방법을 선억적으로 지정
apiVersion: monitoring.coreos.com/v1
kind: PodMonitor
metadata:
  name: example
  namespace: monitoring
spec:
  selector:
    matchLabels:
      app: prometheus
  podMetricsEndpoints:
    - port: web
      interval: 30s
-
Probe : Ingress 또는 정적 대상 그룹을 모니터링하는 방법을 선언적으로 지정
apiVersion: monitoring.coreos.com/v1
kind: Probe
metadata:
  name: servers
  namespace: monitoring
spec:
  jobName: servers
  interval: 10s
  prober:
    url: localhost
    path: /metrics
  metricRelabelings:
  - sourceLabels: [__address__]
    targetLabel: target
  targets:
    staticConfig:
      static:
      - 192.168.0.1:9182
      - 192.168.0.2:9182
      relabelingConfigs:
      - sourceLabels: [__param_target]
        targetLabel: instance
      - sourceLabels: [__param_target]
        targetLabel: __address__
-
PrometheusRule : 프로메테우스 경고 및 기록 규칙 집합을 정의
apiVersion: monitoring.coreos.com/v1
kind: PrometheusRule
metadata:
  name: prometheus-example-rules
  namespace: monitoring
spec:
  groups:
    - name: ./example.rules
      rules:
        - alert: ExampleAlert
          expr: vector(1)
-
AlertmanagerConfig : Alertmanager 구성의 하위 섹션을 선언적으로 지정
apiVersion: monitoring.coreos.com/v1alpha1
kind: AlertmanagerConfig
metadata:
  name: example
  namespace: monitoring
spec:
  receivers:
    - name: example
  route:
    receiver: example
보다 자세한 CRDs의 설명은 [링크]를 참조하세요.
보다 자세한 API types에 대한 설명은 [링크]를 참조하세요.
Prometheus Operator는 세 가지 방법으로 설치가 가능합니다.
- Prometheus Operator : bundle YAML manifest로 설치
- kube-prometheus : YAML manifest로 설치하며 다음의 구성요소가 패키지로 포함됨 (Prometheus Operator, Prometheus[HA], Alertmanager[HA], node-exporter, Prometheus Adapter for K8s Metrics APIs, kube-state-metrics, Grafana)
- kube-prometheus-stack : kube-prometheus을 Helm Charts로 패키징 (Helm v3+ 필요)
본 내용은 에서는 Prometheus Operator의 bundle YAML manifest와 kube-prometheus-stack의 Helm Charts 두 가지 방법에 대해 다루며 사용하기 편한 방법을 선택하시기 바랍니다.
bundle YAML manifest를 다운로드 받습니다.
manifest에는 Prometheus Operator를 설치하기 위한 CRD, ClusterRoleBinding, ClusterRole, Deployment, ServiceAccount, Service 오브젝트 명세서를 포함하고 있습니다.
$ curl -OL https://raw.githubusercontent.com/prometheus-operator/prometheus-operator/master/bundle.yaml적용전 네임스페이스 값을 변경합니다.
변경전) default → 변경후) prometheus-operator
$ sed -i 's/namespace\: default/namespace\: prometheus\-operator/g' bundle.yaml
$ grep -i 'namespace: prometheus-operator' bundle.yaml
Prometheus Operator가 배포 될 네임스페이스를 생성하고 prometheus-operator를 배포합니다.
$ kubectl create namespace prometheus-operator
namespace/prometheus-operator created

$ kubectl create -n prometheus-operator -f bundle.yaml
customresourcedefinition.apiextensions.k8s.io/alertmanagerconfigs.monitoring.coreos.com created
customresourcedefinition.apiextensions.k8s.io/alertmanagers.monitoring.coreos.com created
customresourcedefinition.apiextensions.k8s.io/podmonitors.monitoring.coreos.com created
customresourcedefinition.apiextensions.k8s.io/probes.monitoring.coreos.com created
customresourcedefinition.apiextensions.k8s.io/prometheuses.monitoring.coreos.com created
customresourcedefinition.apiextensions.k8s.io/prometheusrules.monitoring.coreos.com created
customresourcedefinition.apiextensions.k8s.io/servicemonitors.monitoring.coreos.com created
customresourcedefinition.apiextensions.k8s.io/thanosrulers.monitoring.coreos.com created
clusterrolebinding.rbac.authorization.k8s.io/prometheus-operator created
clusterrole.rbac.authorization.k8s.io/prometheus-operator created
deployment.apps/prometheus-operator created
serviceaccount/prometheus-operator created
service/prometheus-operator created
주의) prometheus-operator를 배포 할 때 kubectl CLI에서 apply가 아닌 create 사용 또는 apply 사용시 “—server-side” 옵션을 함께 사용하세요.
apply를 사용하게 되면 다음과 같은 오류메세지를 만나게 되며,
The CustomResourceDefinition "prometheuses.monitoring.coreos.com" is invalid: metadata.annotations: Too long: must have at most 262144 bytesapply로 리소스를 생성/업데이트 할 때 마다 명세서의 *metadata.annotation*에 *kubectl.kubernetes.io/last-applied-configuration*필드에 JSON 문서가 추가되기 때문입니다.
[참조 I] 쿠버네티스 공식 홈페이지의 How to create objects에서 kubectl apply의 설명
[참조 II] Kubectl Install CRD Failed — Annotations Too Long
[참조 III] Server-Side Apply
YAML manifest를 사용하여 생성된 CRDs들은 무엇이 있는지 그리고 배포된 리소스들은 무엇이 있는지 확인해보겠습니다.
-
CRDs
$ kubectl get crds | grep coreos alertmanagerconfigs.monitoring.coreos.com 2022-06-08T10:04:27Z alertmanagers.monitoring.coreos.com 2022-06-08T10:04:27Z podmonitors.monitoring.coreos.com 2022-06-08T10:04:28Z probes.monitoring.coreos.com 2022-06-08T10:04:28Z prometheuses.monitoring.coreos.com 2022-06-08T10:04:28Z prometheusrules.monitoring.coreos.com 2022-06-08T10:04:28Z servicemonitors.monitoring.coreos.com 2022-06-08T10:04:28Z thanosrulers.monitoring.coreos.com 2022-06-08T10:04:28Z -
Objects
$ kubectl get all -n prometheus-operator
NAME                                       READY   STATUS    RESTARTS   AGE
pod/prometheus-operator-567cd8b6f6-nhnr5   1/1     Running   0          99s

NAME                          TYPE        CLUSTER-IP   EXTERNAL-IP   PORT(S)    AGE
service/prometheus-operator   ClusterIP   None         <none>        8080/TCP   99s

NAME                                  READY   UP-TO-DATE   AVAILABLE   AGE
deployment.apps/prometheus-operator   1/1     1            1           99s

NAME                                             DESIRED   CURRENT   READY   AGE
replicaset.apps/prometheus-operator-567cd8b6f6   1         1         1       99s
Prometheus-Community에서 제공하는 Helm Chart package중 kube-prometheus-stack를 사용하는 설치를 알아보겠습니다. 먼저 helm chart repo를 등록합니다.
$ helm repo add prometheus-community https://prometheus-community.github.io/helm-charts
$ helm repo update
helm show crds를 사용하여 charts를 사용하여 설치되는 CRDs은 어떤 것들이 있는지 확인해보겠습니다.
$ helm show crds prometheus-community/kube-prometheus-stack > kube-prometheus-stack-crds.yaml

$ grep -A7 '^kind: CustomResourceDefinition' kube-prometheus-stack-crds.yaml | grep '^  name:' | awk '{print $2}' | sort -u
alertmanagerconfigs.monitoring.coreos.com
alertmanagers.monitoring.coreos.com
podmonitors.monitoring.coreos.com
probes.monitoring.coreos.com
prometheuses.monitoring.coreos.com
prometheusrules.monitoring.coreos.com
servicemonitors.monitoring.coreos.com
thanosrulers.monitoring.coreos.com
Prometheus Community의 kube-prometheus-stack은 Prometheus-Operator의 kube-prometheus를 Helm Chart로 패키징 했기 때문에 kube-prometheus에서 제공하는 Prometheus[HA], Alertmanager[HA], node-exporter, Prometheus Adapter for K8s Metrics APIs, kube-state-metrics, Grafana 들이 포함되어 있습니다.
본 내용에서는 Prometheus-Operator만을 설치하기 위해 패키징 되어 제공되는 것들의 배포는 생략합니다.
$ helm install prometheus-operator prometheus-community/kube-prometheus-stack -n prometheus-operator --create-namespace \
--set grafana.enabled=false \
--set alertmanager.enabled=false \
--set prometheus.enabled=false \
--set nodeExporter.enabled=false \
--set kubeStateMetrics.enabled=false \
--set prometheusOperator.enabled=true
NAME: prometheus-operator
LAST DEPLOYED: Thu Jun  9 16:31:20 2022
NAMESPACE: prometheus-operator
STATUS: deployed
REVISION: 1
TEST SUITE: None
NOTES:
kube-prometheus-stack has been installed. Check its status by running:
  kubectl --namespace prometheus-operator get pods -l "release=prometheus-operator"

Visit https://github.com/prometheus-operator/kube-prometheus for instructions on how to create & configure Alertmanager and Prometheus instances using the Operator.
Helm charts로 생성된 CRDs들은 무엇이 있는지 그리고 배포된 리소스들은 무엇이 있는지 확인해보겠습니다.
-
CRDs
$ kubectl get crds | grep coreos alertmanagerconfigs.monitoring.coreos.com 2022-06-09T07:31:18Z alertmanagers.monitoring.coreos.com 2022-06-09T07:31:18Z podmonitors.monitoring.coreos.com 2022-06-09T07:31:18Z probes.monitoring.coreos.com 2022-06-09T07:31:18Z prometheuses.monitoring.coreos.com 2022-06-09T07:31:18Z prometheusrules.monitoring.coreos.com 2022-06-09T07:31:18Z servicemonitors.monitoring.coreos.com 2022-06-09T07:31:18Z thanosrulers.monitoring.coreos.com 2022-06-09T07:31:18Z -
Objects
$ kubectl get all -n prometheus-operator
NAME                                                       READY   STATUS    RESTARTS   AGE
pod/prometheus-operator-kube-p-operator-7d9dbbc6db-hgl2x   1/1     Running   0          8m53s

NAME                                          TYPE        CLUSTER-IP      EXTERNAL-IP   PORT(S)   AGE
service/prometheus-operator-kube-p-operator   ClusterIP   10.104.57.243   <none>        443/TCP   8m53s

NAME                                                  READY   UP-TO-DATE   AVAILABLE   AGE
deployment.apps/prometheus-operator-kube-p-operator   1/1     1            1           8m53s

NAME                                                             DESIRED   CURRENT   READY   AGE
replicaset.apps/prometheus-operator-kube-p-operator-7d9dbbc6db   1         1         1       8m53s
kubectl api-resource 명령을 사용하여 Prometheus Operator의 Kubernetes API resource 정보를 확인하고 각 오브젝트들의 shortname을 알아보겠습니다.
$ kubectl api-resources | egrep '^NAME|coreos'
NAME                              SHORTNAMES         APIVERSION                             NAMESPACED   KIND
alertmanagerconfigs               amcfg              monitoring.coreos.com/v1alpha1         true         AlertmanagerConfig
alertmanagers                     am                 monitoring.coreos.com/v1               true         Alertmanager
podmonitors                       pmon               monitoring.coreos.com/v1               true         PodMonitor
probes                            prb                monitoring.coreos.com/v1               true         Probe
prometheuses                      prom               monitoring.coreos.com/v1               true         Prometheus
prometheusrules                   promrule           monitoring.coreos.com/v1               true         PrometheusRule
servicemonitors                   smon               monitoring.coreos.com/v1               true         ServiceMonitor
thanosrulers                      ruler              monitoring.coreos.com/v1               true         ThanosRuler
Prometheus Operator를 위한 RBAC(역할 기반 접근 제어)은 두개의 파트로 다음과 같습니다.
첫째로 Prometheus Operator 자체에 대한 RBAC 규칙
둘째로 Prometheus가 target 및 Alertmanater 검색을 위해 Kubernetes API에 접근이 필요하므로 Prometheus Operator가 생성한 Prometheus Pod 자체에 대한 RBAC 규칙
Prometheus Operator가 RBAC 기반 권한 부여 환경에서 작동하기 위해서는 Operator가 Kubernetes API에 필요한 모든 리소스에 접근할 수 있는 권한을 부여하기 위해 ClusterRole이 있어야 합니다.
Prometheus Operator에 RBAC를 위한 ClusterRole, ClusterRoleBinding, ServiceAccount는 Operator를 설치하는 과정에서 기본적으로 생성되며 다음과 같습니다.
$ kubectl get clusterrole,clusterrolebinding | egrep -i '^NAME|prometheus'
NAME                                                           CREATED AT
clusterrole.rbac.authorization.k8s.io/prometheus-operator      2022-06-09T08:33:30Z

NAME                                                                   ROLE                               AGE
clusterrolebinding.rbac.authorization.k8s.io/prometheus-operator       ClusterRole/prometheus-operator    73m

$ kubectl get sa/prometheus-operator -n prometheus-operator
NAME                                 SECRETS   AGE
serviceaccount/prometheus-operator   1         73m
Prometheus Operator는 customresourcedefinitions(CRDs)와 함께 광범위하게 작동함에 따라 다음 object들에 모든 권한이 요구 됩니다.
- alertmanagers
- podmonitors
- probes
- prometheuses
- prometheusrules
- servicemonitors
- thanosrulers
그렇다면 필요한 권한이 모두 부여 되었는지 kubectl describe 명령으로 ClusterRole을 확인해보겠습니다.
$ kubectl describe clusterrole/prometheus-operator
Name:         prometheus-operator
Labels:       app.kubernetes.io/component=controller
              app.kubernetes.io/name=prometheus-operator
              app.kubernetes.io/version=0.57.0
Annotations:  <none>
PolicyRule:
  Resources                                       Non-Resource URLs  Resource Names  Verbs
  ---------                                       -----------------  --------------  -----
  configmaps                                      []                 []              [*]
  secrets                                         []                 []              [*]
  statefulsets.apps                               []                 []              [*]
  alertmanagerconfigs.monitoring.coreos.com       []                 []              [*]
  alertmanagers.monitoring.coreos.com/finalizers  []                 []              [*]
  alertmanagers.monitoring.coreos.com             []                 []              [*]
  podmonitors.monitoring.coreos.com               []                 []              [*]
  probes.monitoring.coreos.com                    []                 []              [*]
  prometheuses.monitoring.coreos.com/finalizers   []                 []              [*]
  prometheuses.monitoring.coreos.com/status       []                 []              [*]
  prometheuses.monitoring.coreos.com              []                 []              [*]
  prometheusrules.monitoring.coreos.com           []                 []              [*]
  servicemonitors.monitoring.coreos.com           []                 []              [*]
  thanosrulers.monitoring.coreos.com/finalizers   []                 []              [*]
  thanosrulers.monitoring.coreos.com              []                 []              [*]
  endpoints                                       []                 []              [get create update delete]
  services/finalizers                             []                 []              [get create update delete]
  services                                        []                 []              [get create update delete]
  namespaces                                      []                 []              [get list watch]
  ingresses.networking.k8s.io                     []                 []              [get list watch]
  pods                                            []                 []              [list delete]
  nodes                                           []                 []              [list watch]
ClusterRole와 묶인 ClusterRoleBinding을 describe 해서 보면 prometheus-operator ClusterRole과 prometheus-operator ServiceAccount objects들이 묶인 것을 알 수 있습니다.
$ kubectl describe clusterrolebinding/prometheus-operator
Name:         prometheus-operator
Labels:       app.kubernetes.io/component=controller
              app.kubernetes.io/name=prometheus-operator
              app.kubernetes.io/version=0.57.0
Annotations:  <none>
Role:
  Kind:  ClusterRole
  Name:  prometheus-operator
Subjects:
  Kind            Name                 Namespace
  ----            ----                 ---------
  ServiceAccount  prometheus-operator  prometheus-operator
그렇다면 Prometheus Operator는 왜 이렇게 많은 RBAC 기반 권한이 필요 할까요? 이유는 다음과 같습니다.
- Alertmanager와 Prometheus 클러스터는
StatefulSets을 사용하여 생성 합니다. 따라서 Alertmanager 또는 Prometheus objects에 대한 모든 변경 사항은StatefulSets에 대한 변경으로 이루어 지기 때문에prometheus.monitoring.coreos.com리소스에 대해 모든 권한 허용되어야 합니다. - Prometheus가 실행되도록 configurations 생성을 처리하므로
ConfigMaps에 대한 권한 허용이 필요합니다. - Prometheus 또는 Alertmanager의 한 버전에서 다른 버전으로 마이그레이션을 수행 할 때 새로운 버전의 Pods 구동을 위해
list가 그리고 이전 버전을 삭제하기 위해delete권한 허용이 필요합니다. - Prometheus Operator는
StatefulSet을 위한 관리로Service를 사용하며 이것들은prometheus-operatored와alertmanager-operated라고 부르며Servicesobject를 조정(reconcile) 합니다. 그리고 이 조정(reconciliation)을 수행하려면get,create,update그리고delete권한 허용이 필요합니다. - 현재 kubelet은 self-hosted가 되지 않기 때문에 Pormetheus Operator는 kubelet의 IP를 Endpoints object로 동기화하는 기능이 있으며,
nodes(kubelet)에list,watch그리고endpoints를 위해create,update의 접근 권한 허용이 필요합니다. [링크]
Prometheus 서버는 target을 scrape하고 Alertmanager 검색을 위해 Kubernetes API에 접근 하게되며, 해당 리소스에 접근을 하기 위해서 ServiceAccount가 필요하고 ClusterRole을 생성하여 binding 해주어야 합니다.
또한, Prometheus는 Kubernetes API에서 object를 수정하지 않고 읽기만 하기 때문에 get, list 그리고 watch 작업의 권한만 필요하며, Kubernetes API에서 지표(metric)를 가져오는데로 사용할수 있으므로 지표를 스크랩하기 위해서는 /metrics/ Endpoint에 대한 접근허용도 필요합니다.
Prometheus 배포에 앞서 권한 할당을 위해 ClusterRole을 생성 합니다.
$ cat <<EOF | kubectl apply -f -
apiVersion: rbac.authorization.k8s.io/v1
kind: ClusterRole
metadata:
  labels:
    release: prometheus-operator
  name: prometheus
rules:
- apiGroups: [""]
  resources:
  - nodes
  - nodes/metrics
  - services
  - endpoints
  - pods
  verbs: ["get", "list", "watch"]
- apiGroups: [""]
  resources:
  - configmaps
  verbs: ["get"]
- apiGroups:
  - networking.k8s.io
  resources:
  - ingresses
  verbs: ["get", "list", "watch"]
- nonResourceURLs: ["/metrics"]
  verbs: ["get"]
EOFClusterRoleBinding을 생성 합니다.
$ cat <<EOF | kubectl apply -f -
apiVersion: rbac.authorization.k8s.io/v1
kind: ClusterRoleBinding
metadata:
  labels:
    release: prometheus-operator
  name: prometheus
roleRef:
  apiGroup: rbac.authorization.k8s.io
  kind: ClusterRole
  name: prometheus
subjects:
- kind: ServiceAccount
  name: prometheus
  namespace: monitoring
EOFClusterRole을 ClusterRoleBinding과 잘 묶어져 있는지 확인합니다.
$ kubectl describe clusterrolebinding prometheus
ame:         prometheus
Labels:       release=prometheus-operator
Annotations:  <none>
Role:
  Kind:  ClusterRole
  Name:  prometheus
Subjects:
  Kind            Name        Namespace
  ----            ----        ---------
  ServiceAccount  prometheus  monitoring
monitoring 이름의 네임스페이스를 생성합니다.
$ kubectl create namespace monitoring
namespace/monitoring created
prometheus 이름의 ServiceAccount를 앞서 생성한 monitoring 네임스페이스 안에 생성합니다.
$ cat <<EOF | kubectl apply -n monitoring -f -
apiVersion: v1
kind: ServiceAccount
metadata:
  labels:
    release: prometheus-operator
  name: prometheus
  namespace: monitoring
EOF
Step 3.1. Prometheus
Prometheus CR을 정의하여 Prometheus 서버를 배포 하겠습니다.. spec 각 필드에 대한 자세한 설명은 Prometheus Operator API [링크] 설명서를 참조 하시기 바랍니다.
$ cat <<EOF | kubectl apply -n monitoring -f -
apiVersion: monitoring.coreos.com/v1
kind: Prometheus
metadata:
  labels:
    release: prometheus-operator
  name: prometheus
  namespace: monitoring
spec:
  alerting:
    alertmanagers:
    - apiVersion: v2
      name: alertmanager-operated
      namespace: monitoring
      pathPrefix: /
      port: http-web
  enableAdminAPI: false
  evaluationInterval: 30s
  externalUrl: http://prometheus-service.monitoring:9090
  image: quay.io/prometheus/prometheus:v2.36.0
  listenLocal: false
  logFormat: logfmt
  logLevel: info
  paused: false
  podMonitorNamespaceSelector: {}
  podMonitorSelector:
    matchLabels:
      release: prometheus-operator
  portName: http-web
  probeNamespaceSelector: {}
  probeSelector:
    matchLabels:
      release: prometheus-operator
  replicas: 2
  retention: 10d
  routePrefix: /
  ruleNamespaceSelector: {}
  ruleSelector:
    matchLabels:
      release: prometheus-operator
  scrapeInterval: 30s
  securityContext:
    fsGroup: 2000
    runAsGroup: 2000
    runAsNonRoot: true
    runAsUser: 1000
  serviceAccountName: prometheus
  serviceMonitorNamespaceSelector: {}
  serviceMonitorSelector:
    matchLabels:
      release: prometheus-operator
  shards: 1
  version: v2.36.0
EOF
Prometheus Operator는 Prometheus CR이 생성 된 것을 감지하고 StatefulSets과 Serivce를 생성 합니다.
$ kubectl get all,prometheus -n monitoring
NAME                          READY   STATUS    RESTARTS   AGE
pod/prometheus-prometheus-0   2/2     Running   0          70s
pod/prometheus-prometheus-1   1/2     Running   0          10s

NAME                          TYPE        CLUSTER-IP   EXTERNAL-IP   PORT(S)    AGE
service/prometheus-operated   ClusterIP   None         <none>        9090/TCP   70s

NAME                                     READY   AGE
statefulset.apps/prometheus-prometheus   1/2     70s

NAME                                          VERSION   REPLICAS   AGE
prometheus.monitoring.coreos.com/prometheus   v2.36.0   2          71s
prometheus-operated serveice 리소스도 함께 생성이 되며 Headless Service라는 것을 알 수 있습니다.
$ kubectl describe svc/prometheus-operated -n monitoring
Name: prometheus-operated
Namespace: monitoring
Labels: operated-prometheus=true
Annotations: <none>
Selector: app.kubernetes.io/name=prometheus
Type: ClusterIP
IP Family Policy: SingleStack
IP Families: IPv4
IP: None
IPs: None
Port: http-web 9090/TCP
TargetPort: http-web/TCP
Endpoints: 172.16.10.109:9090,172.16.84.122:9090
Session Affinity: None
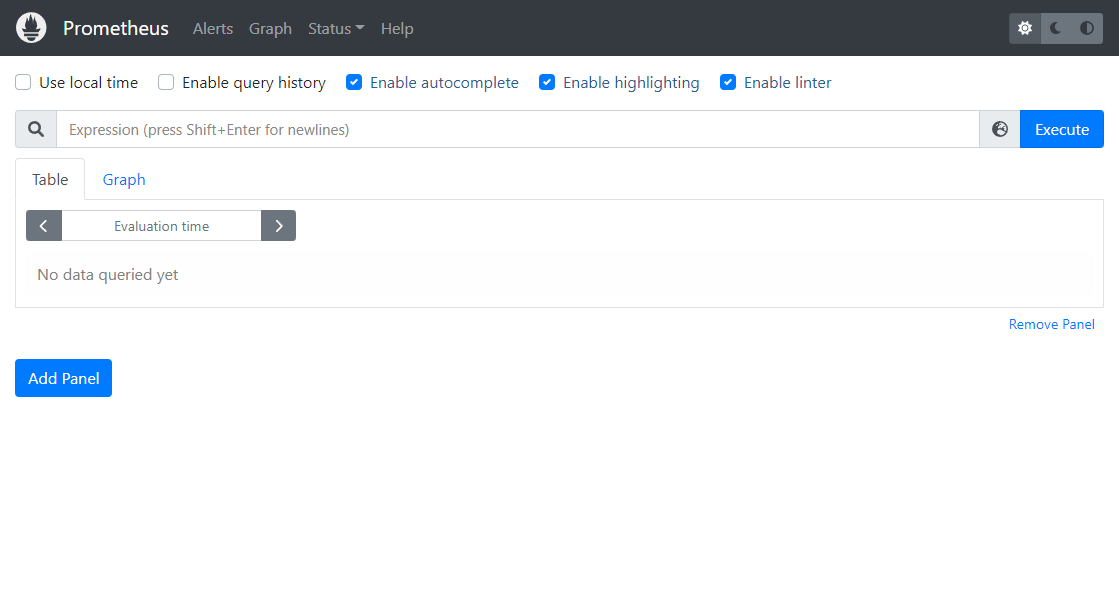
Events: <none>다음으로 Pormetheus의 UI에 접속 해 보겠습니다. 기본적으로 생성되는 prometheus-operated service는 Headless Service로 포트 포워딩을 사용해서 클러스터 내에 있는 prometheu 서버에 접근할 수 있습니다.
$ kubectl port-forward svc/prometheus-operated 9090 -n monitoring
Forwarding from 127.0.0.1:9090 -> 9090
Forwarding from [::1]:9090 -> 9090
또는 외부에서 접속 할 수 있는 Endpoint로 service 리소스를 추가로 생성할 수 있습니다.
$ cat <<EOF | kubectl apply -n monitoring -f -
apiVersion: v1
kind: Service
metadata:
  labels:
    release: prometheus-operator
  name: prometheus-service
  namespace: monitoring
spec:
  internalTrafficPolicy: Cluster
  ipFamilies:
  - IPv4
  ipFamilyPolicy: SingleStack
  ports:
  - name: http-web
    port: 9090
    protocol: TCP
    targetPort: 9090
  selector:
    app.kubernetes.io/name: prometheus
    prometheus: prometheus
  sessionAffinity: None
  type: LoadBalancer
EOF
$ kubectl get svc/prometheus-service -n monitoring -o wide
NAME TYPE CLUSTER-IP EXTERNAL-IP PORT(S) AGE SELECTOR
prometheus-service LoadBalancer 10.101.188.215 192.168.1.182 9090:32663/TCP 13s app.kubernetes.io/name=prometheus,prometheus=prometheus포트 포워딩을 하셨다면 웹브라우저에서 http://127.0.0.1:9090으로 접속이 가능하고, 추가 Service 리소스를 생성 했다면 expose type에 따라 생성되는 Endpoint 주소로 접속하시면 됩니다.
필자는 MetalLB를 사용하고 있어 LoadBalancer 유형을 사용하여 생성된 Endpoint로 접속 했습니다.
Step 3.2. ServiceMonitor
ServiceMonitor는 Kubernetes 내에서 Service 오브젝트로 부터 지표(metric)을 스크랩하려는 애플리케이션을 정의하는 데 사용되며, 컨트롤러는 우리가 정의한 ServiceMonitor를 작동시키고 필요한 Prometheus 서버의 ConfitMap 구성을 자동으로 관리해주는 Prometheus Operator의 CR(custom resource) 중에 하나 입니다.
ServiceMonitor CR을 사용하면 Prometheus에서 모니터링할 대상(targe)을 직접 수정할 필요 없이 자동으로 대상들을 관리 할 수 있습니다.
Prometheus의 Service로 부터 지표를 스크랩할 수 있도록 ServiceMonitor CR을 생성하겠습니다.
$ cat <<EOF | kubectl apply -n monitoring -f -
apiVersion: monitoring.coreos.com/v1
kind: ServiceMonitor
metadata:
  labels:
    release: prometheus-operator
  name: prometheus-servicemonitor
  namespace: monitoring
spec:
  endpoints:
  - path: /metrics
    port: http-web
  namespaceSelector:
    matchNames:
    - monitoring
  selector:
    matchLabels:
      release: prometheus-operator
EOF

$ kubectl get smon -n monitoring -o wide
NAME                          AGE
prometheus-servicemonitor     30s
ServiceMonitor에 의해 스크랩되는 대상 지표(metric)의 설정이 잘 적용 되었고 어떤 구성 설정이 적용 되었는지 확인해보겠습니다.
<scrape_config> 구성 설정에 대한 자세한 설졍은 [링크]에서 확인하세요.
$ kubectl exec -it prometheus-prometheus-0 -n monitoring -- cat /etc/prometheus/config_out/prometheus.env.yaml
global:
evaluation_interval: 30s
scrape_interval: 30s
external_labels:
prometheus: monitoring/prometheus
prometheus_replica: prometheus-prometheus-0
rule_files:
- /etc/prometheus/rules/prometheus-prometheus-rulefiles-0/*.yaml
scrape_configs:
- job_name: serviceMonitor/monitoring/prometheus-servicemonitor/0
honor_labels: false
kubernetes_sd_configs:
- role: endpoints
namespaces:
names:
- monitoring
metrics_path: /metrics
relabel_configs:
- source_labels:
- job
target_label: __tmp_prometheus_job_name
- action: keep
source_labels:
- __meta_kubernetes_service_label_release
- __meta_kubernetes_service_labelpresent_release
regex: (prometheus-operator);true
- action: keep
source_labels:
- __meta_kubernetes_endpoint_port_name
regex: http-web
- source_labels:
- __meta_kubernetes_endpoint_address_target_kind
- __meta_kubernetes_endpoint_address_target_name
separator: ;
regex: Node;(.*)
replacement: ${1}
target_label: node
- source_labels:
- __meta_kubernetes_endpoint_address_target_kind
- __meta_kubernetes_endpoint_address_target_name
separator: ;
regex: Pod;(.*)
replacement: ${1}
target_label: pod
- source_labels:
- __meta_kubernetes_namespace
target_label: namespace
- source_labels:
- __meta_kubernetes_service_name
target_label: service
- source_labels:
- __meta_kubernetes_pod_name
target_label: pod
- source_labels:
- __meta_kubernetes_pod_container_name
target_label: container
- source_labels:
- __meta_kubernetes_service_name
target_label: job
replacement: ${1}
- target_label: endpoint
replacement: http-web
- source_labels:
- __address__
target_label: __tmp_hash
modulus: 1
action: hashmod
- source_labels:
- __tmp_hash
regex: 0
action: keep
metric_relabel_configs: []
alerting:
alert_relabel_configs:
- action: labeldrop
regex: prometheus_replica
alertmanagers:
- path_prefix: /
scheme: http
kubernetes_sd_configs:
- role: endpoints
namespaces:
names:
- monitoring
api_version: v2
relabel_configs:
- action: keep
source_labels:
- __meta_kubernetes_service_name
regex: alertmanager
- action: keep
source_labels:
- __meta_kubernetes_endpoint_port_name
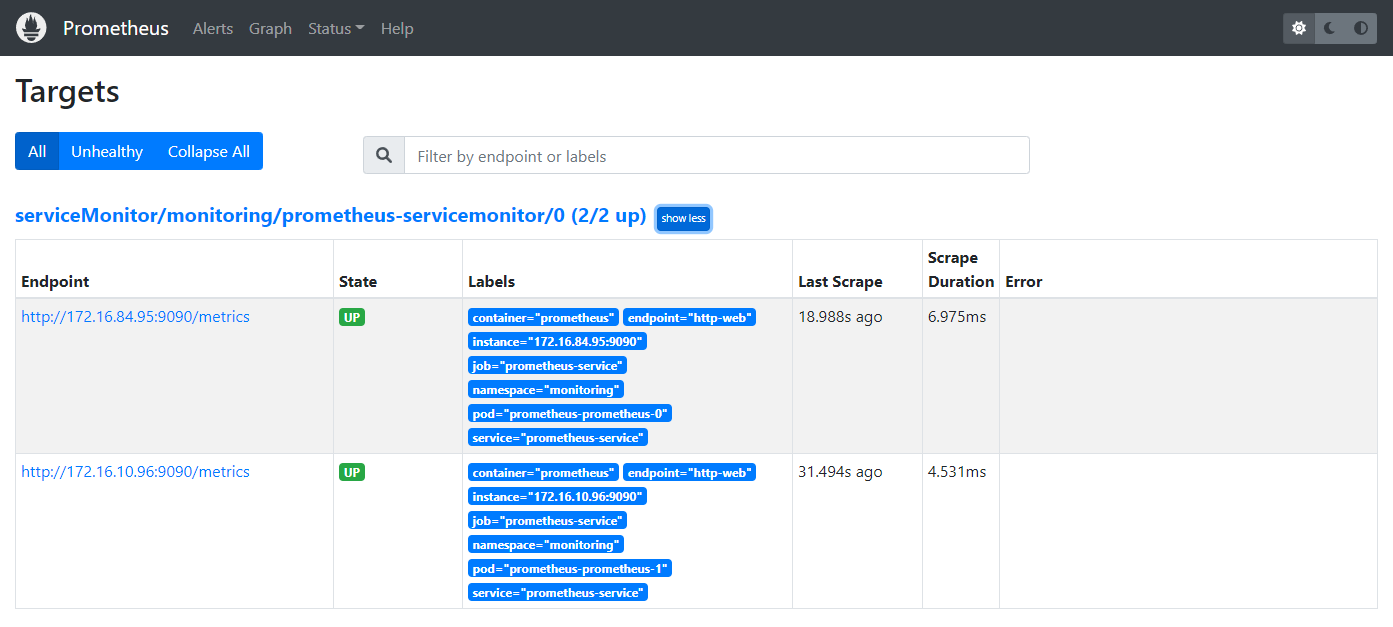
regex: http-webPrometheus Configurations에 scrape_configs 설정이 ServiceMonitor CR을 생성하면서 Prometheus Operator에 의해 자동 구성 된것을 알 수 있습니다.
내용만 보아도 상당히 복잡한 설정으로 개발자/관리자가 직접 직접 설정을 하기에는 쉽지 않습니다. 그러나 Prometheus Operator를 사용함으로서 간단하게 scrape_config 구성을 할 수 있었습니다.
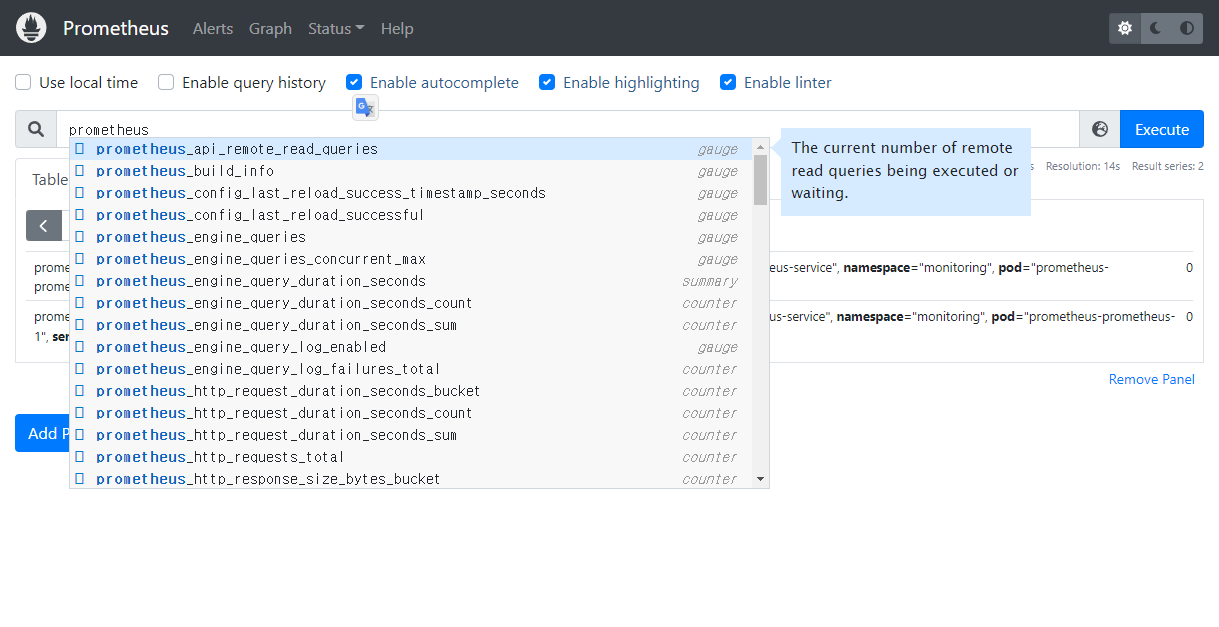
Prometheus Dashboard (UI)에서 Target 추가 되었고 지표(metric)들을 수집되고 있음을 알 수 있습니다.
Step 3.3. PodMonitor
Service 리소스를 사용하는 애플리케이션은 ServiceMonitor CR을 사용하면 되지만 그렇지 않는 Pod는 PodMonitor CR을 사용하여 Pod로 부터 직접 스크래핑을 할 수 있습니다.
또는 Service 리소스를 사용하고 있지만 직접적으로 연결하지 않는 Pod(sidecar container)도 가능합니다.. 예를 들어 Istio sidecars 같은 것들이 있겠네요.
kube-state-metrics Pod에서 직접 대상을 스크래핑 해보도록 하겠습니다. PodMonitor CR을 생성하기전에 kube-state-metrics을 배포 합니다.
$ helm install kube-state-metrics prometheus-community/kube-state-metrics -n kube-system

$ kubectl get all -n kube-system | egrep 'NAME|kube-state-metrics' | grep -v 'SELECTOR'
NAME                                           READY   STATUS    RESTARTS          AGE
pod/kube-state-metrics-77f54c6d8b-k56ht        1/1     Running   0                 13m

NAME                                         TYPE        CLUSTER-IP       EXTERNAL-IP   PORT(S)      AGE
service/kube-state-metrics                   ClusterIP   10.110.249.203   <none>        8080/TCP     13m

NAME                                      READY   UP-TO-DATE   AVAILABLE   AGE
deployment.apps/kube-state-metrics        1/1     1            1           13m
NAME                                                 DESIRED   CURRENT   READY   AGE
replicaset.apps/kube-state-metrics-77f54c6d8b        1         1         1       13m
이제 PodMonitor CR을 생성합니다. 이때 label selector를 위해 app.kubernetes.io/component: metrics와 app.kubernetes.io/instance: kube-state-metrics 사용하게 되는데 label에 대한 정보는 kube-state-metrics Pod를 kubectl describe로 확인하면 알 수 있습니다.
$ cat << EOF | kubectl apply -n monitoring -f -
apiVersion: monitoring.coreos.com/v1
kind: PodMonitor
metadata:
  name: kube-state-metric-podmonitor
  labels:
    release: prometheus-operator
spec:
  namespaceSelector:
    matchNames:
      - kube-system
  selector:
    matchLabels:
      app.kubernetes.io/component: metrics
      app.kubernetes.io/instance: kube-state-metrics
  podMetricsEndpoints:
  - targetPort: 8080
EOF

$ kubectl get pmon -n monitoring
NAME                            AGE
kube-state-metric-podmonitor 40sPodMonitor를 생성 하였지만 Prometheus 서버는 아무런 변화가 없을 겁니다. 왜냐하면 위에서 Prometheus CR을 사용하여 Prometheus 서버를 배포 하였지만 PodMonitor의 구성 설정중 podMonitorSelector.matchLabels 필드의 값으로 release: prometheus-operator을 정의 하였기 때문에 PodMonitor는 주어진 값의 Label을 우선 찾기 때문입니다. 그렇지만 kube-state-metric Pod의 Label에는 해당 값이 없기때문에 Pod를 찾을 수 없습니다. 간단히 podMonitorSelector 필드에 값을 {}으로 변경하여 label selector에 대한 조건을 지정하지 않으면 됩니다. kubectl edit 명령을 사용하여 필드 값을 변경해주세요.
$ kubectl get prom/prometheus -n monitoring -o yaml | egrep '  podMonitorNamespaceSelector|  podMonitorSelector'
  podMonitorNamespaceSelector: {}
  podMonitorSelector: {}
Prometheus 서버의 Pod를 보면 PodMonitor로 추가된 target(대상)의 구성 정보가 Prometheus 서버의 sidecar config-reloader 컨테이너에 의해 동적으로 변경 되었습니다.
$ kubectl exec -it prometheus-prometheus-0 -n monitoring -- cat /etc/prometheus/config_out/prometheus.env.yaml | grep -A47 -i "podMonitor/monitoring/kube-state-metric-podmonitor"
- job_name: podMonitor/monitoring/kube-state-metric-podmonitor/0
  honor_labels: false
  kubernetes_sd_configs:
  - role: pod
    namespaces:
      names:
      - kube-system
  relabel_configs:
  - source_labels:
    - job
    target_label: __tmp_prometheus_job_name
  - action: keep
    source_labels:
    - __meta_kubernetes_pod_label_app_kubernetes_io_component
    - __meta_kubernetes_pod_labelpresent_app_kubernetes_io_component
    regex: (metrics);true
  - action: keep
    source_labels:
    - __meta_kubernetes_pod_label_app_kubernetes_io_instance
    - __meta_kubernetes_pod_labelpresent_app_kubernetes_io_instance
    regex: (kube-state-metrics);true
  - action: keep
    source_labels:
    - __meta_kubernetes_pod_container_port_number
    regex: "8080"
  - source_labels:
    - __meta_kubernetes_namespace
    target_label: namespace
  - source_labels:
    - __meta_kubernetes_pod_container_name
    target_label: container
  - source_labels:
    - __meta_kubernetes_pod_name
    target_label: pod
  - target_label: job
    replacement: monitoring/kube-state-metric-podmonitor
  - target_label: endpoint
    replacement: "8080"
  - source_labels:
    - __address__
    target_label: __tmp_hash
    modulus: 1
    action: hashmod
  - source_labels:
    - __tmp_hash
    regex: 0
    action: keep
  metric_relabel_configs: []
ServiceMonitor와 ProdMonitor의 생성으로 configuration의 내용이 추가되면 Prometheus 서버의 sidecar container인 prometheus-config-reloader에 의해 Pormetheus 서버의 설정을 reload 하여 적용 합니다.

$ kubectl describe pod/prometheus-prometheus-0 -n monitoring
.
.
.
config-reloader:
Container ID: containerd://a5c6c9003f13d9bd8eaa6336f6f01d05a6ae14f53a9c4eb093dd27df98e6c805
Image: quay.io/prometheus-operator/prometheus-config-reloader:v0.57.0
Image ID: quay.io/prometheus-operator/prometheus-config-reloader@sha256:8c45787645d17c51acb44aa0386af3aa5d8bfd7bddd8d57dd041878b9494c5ff
Port: 8080/TCP
Host Port: 0/TCP
Command:
/bin/prometheus-config-reloader
Args:
--listen-address=:8080
--reload-url=http://localhost:9090/-/reload
--config-file=/etc/prometheus/config/prometheus.yaml.gz
--config-envsubst-file=/etc/prometheus/config_out/prometheus.env.yaml
--watched-dir=/etc/prometheus/rules/prometheus-prometheus-rulefiles-0
State: Running
Started: Sat, 11 Jun 2022 01:02:51 +0900
.
.
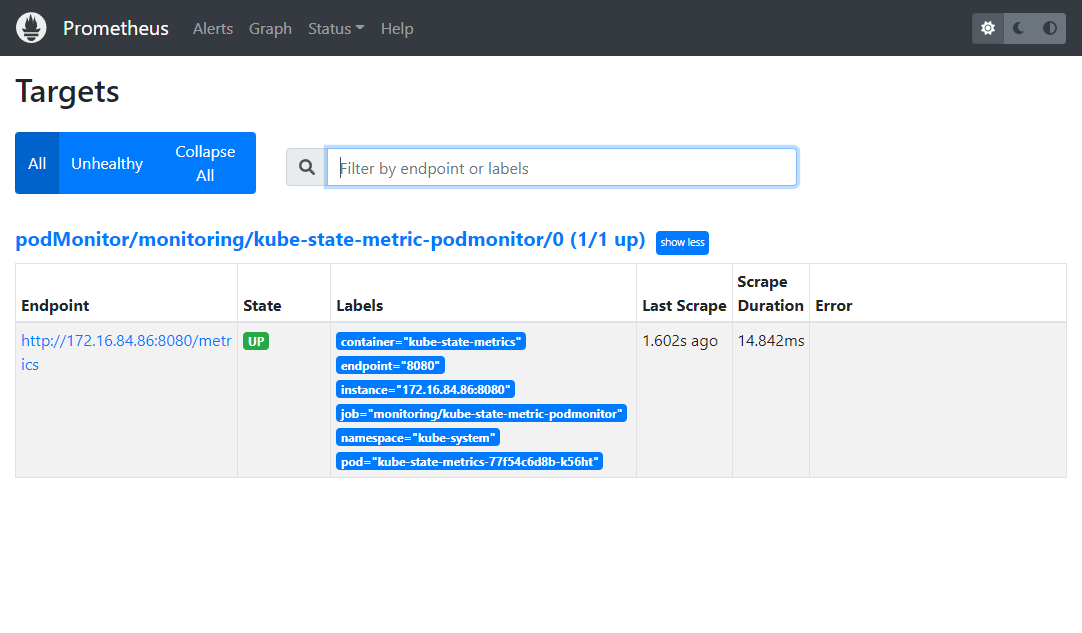
.Prometheus Dashboard (UI)에서 PodMonitor의 target을 확인 할 수 있습니다.
Step 3.4. Alertmanager
Alertmanager CR을 정의하여 Alertmanager 서버를 배포 합니다.
$ cat <<EOF | kubectl apply -n monitoring -f -
apiVersion: monitoring.coreos.com/v1
kind: Alertmanager
metadata:
  name: alertmanager
  namespace: monitoring
spec:
  alertmanagerConfigSelector: {}
  alertmanagerConfigNamespaceSelector: {}
  externalUrl: http://alertmanager-service.monitoring:9093
  image: quay.io/prometheus/alertmanager:v0.24.0
  listenLocal: false
  logFormat: logfmt
  logLevel: info
  paused: false
  portName: "http-web"
  replicas: 1
  routePrefix: /
  securityContext:
    fsGroup: 2000
    runAsGroup: 2000
    runAsNonRoot: true
    runAsUser: 1000
  serviceAccountName: prometheus
  version: v0.24.0
EOF
추가로 Alertmanager 서버의 UI에 접속 하기 위한 service 리소스도 생성 합니다. 만약, 기본 생성되는 alertmanager-operated service를 포트 포워딩 하여 UI 접속을 한다면 이 단계는 생략하셔도 됩니다.
$ cat <<EOF | kubectl apply -n monitoring -f -
apiVersion: v1
kind: Service
metadata:
  labels:
    release: prometheus-operator
  name: alertmanager-service
  namespace: monitoring
spec:
  internalTrafficPolicy: Cluster
  ipFamilies:
  - IPv4
  ipFamilyPolicy: SingleStack
  ports:
  - name: http-web
    port: 9093
    protocol: TCP
    targetPort: 9093
  selector:
    app.kubernetes.io/name: alertmanager
    alertmanager: alertmanager
  sessionAffinity: None
  type: LoadBalancer
EOF
이제 생성된 리소스들을 확인해보겠습니다. 다음과 같이 Alertmanager 서버 Pod, Service, StatefulSets 리소스들이 생성 되었네요.
$ kubectl get all,am -n monitoring | egrep '^NAME|alertmanager'
NAME                              READY   STATUS    RESTARTS      AGE
pod/alertmanager-alertmanager-0   2/2     Running   0             8m

NAME                            TYPE           CLUSTER-IP       EXTERNAL-IP     PORT(S)                      AGE
service/alertmanager-operated   ClusterIP      None             <none>          9093/TCP,9094/TCP,9094/UDP   8m
service/alertmanager-service    LoadBalancer   10.97.21.91      192.168.1.183   9093:32638/TCP               8m

NAME                                         READY   AGE
statefulset.apps/alertmanager-alertmanager   1/1     8m

NAME                                              VERSION   REPLICAS   AGE
alertmanager.monitoring.coreos.com/alertmanager   v0.24.0   1          8m
이제 Dashboard(UI)에 접속 해볼께요. 앞서 추가로 생성한 Service의 Endpoint를 사용하시거나 포트 포워딩을 사용하여 접속하시면 됩니다. http://127,0.0.1:9093
$ kubectl port-forward svc/alertmanager-operated 9093 -n monitoring
Forwarding from 127.0.0.1:9093 -> 9093
Forwarding from [::1]:9093 -> 9093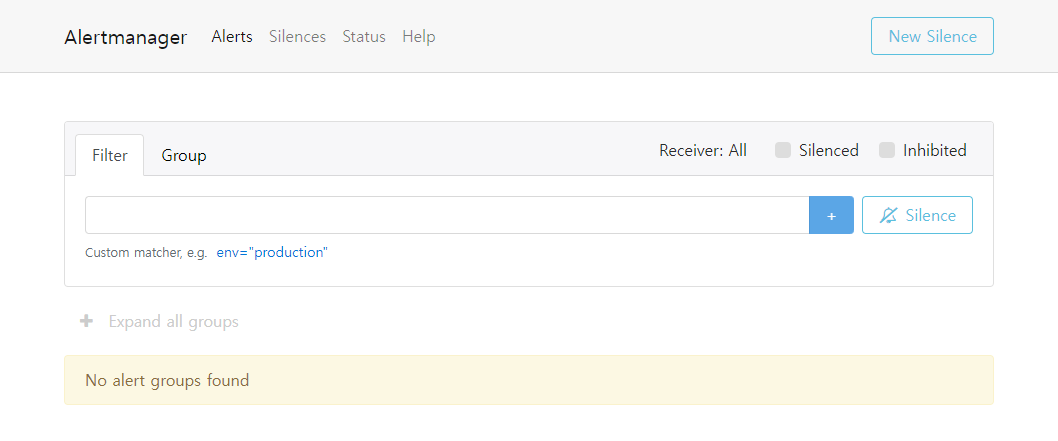
Alertmanager CR을 사용하여 Alertmanager 서버를 배포 했지만 아무런 경보(alert)가 발생하지 않을 겁니다.
Alertmanager의 주된 기능은 공식 홈페이지[링크]에서 볼 수 있듯이 경보(alert)를 통보(notification)할 뿐 실제 경보를 통보하는 것은 Prometheus 서버가 하기 때문에 경보(alert)를 발송하기 위해서는 Alert rules을 Prometheus 서버에 등록 해주어야 하며 PrometheusRule CR 정의하여 Alert rules을 등록 할 수 있습니다.
PrometheusRule 에 대해서는 다음 단계에서 알아보겠습니다.
Step 3.5. PrometheusRule
PrometheusRule CR은 하나 이상의 RuleGroup 정의를 지원하며, 이러한 그룹은 Prometheus에서 지원하는 두 가지 유형의 규칙(recoding과 alerting) 중 하나를 선언적으로 정의할 수 있습니다.
Alert rule을 하나 등록을 해볼텐데 prometheus-node-exporter의 지표(metric) 중 non-root users 파일시스템 공간이 12GB이상 사용 할 수 있는 노드에 대한 경보(alert)를 발생하는 규칙을 정의 해보겠습니다.
이를 위해 prometheus-node-exporter가 배포 되어 있어야 하며, 쿠버네티스 클러스터에 배포 되어 있지 않다면 다음과 같이 배포하시기 바랍니다.
$ helm install node-exporter prometheus-community/prometheus-node-exporter -n kube-system또한, node-exporter의 지표를 수집하기 위해 ServiceMonitor CR을 생성합니다.
$ cat <<EOF | kubectl apply -n monitoring -f -
apiVersion: monitoring.coreos.com/v1
kind: ServiceMonitor
metadata:
  annotations:
    kubectl.kubernetes.io/last-applied-configuration: |
      {"apiVersion":"monitoring.coreos.com/v1","kind":"ServiceMonitor","metadata":{"annotations":{},"labels":{"release":"prometheus-operator"},"name":"prometheus-node-exporter-servicemonitor","namespace":"monitoring"},"spec":{"endpoints":[{"path":"/metrics","port":"metrics"}],"namespaceSelector":{"matchNames":["kube-system"]},"selector":{"matchLabels":{"app":"prometheus-node-exporter","release":"node-exporter"}}}}
  creationTimestamp: "2022-06-11T16:22:44Z"
  generation: 1
  labels:
    release: prometheus-operator
  name: prometheus-node-exporter-servicemonitor
  namespace: monitoring
  resourceVersion: "25028349"
  uid: b5c3c032-0fe4-4263-a0fe-7bc20d8e8116
spec:
  endpoints:
  - path: /metrics
    port: metrics
  namespaceSelector:
    matchNames:
    - kube-system
  selector:
    matchLabels:
      app: prometheus-node-exporter
      release: node-exporter
EOF
이제 PrometheusRule CR을 사용하여 Alert rule을 생성 합니다.
$ cat <<EOF | kubectl apply -n monitoring -f -
apiVersion: monitoring.coreos.com/v1
kind: PrometheusRule
metadata:
labels:
release: prometheus-operator
name: prometheus-example-rules
spec:
groups:
- name: alerting_filesystem
rules:
- alert: node_filesystem_avail_bytes
expr: node_filesystem_avail_bytes > 12361482240
for: 10s
labels:
severity: "critical"
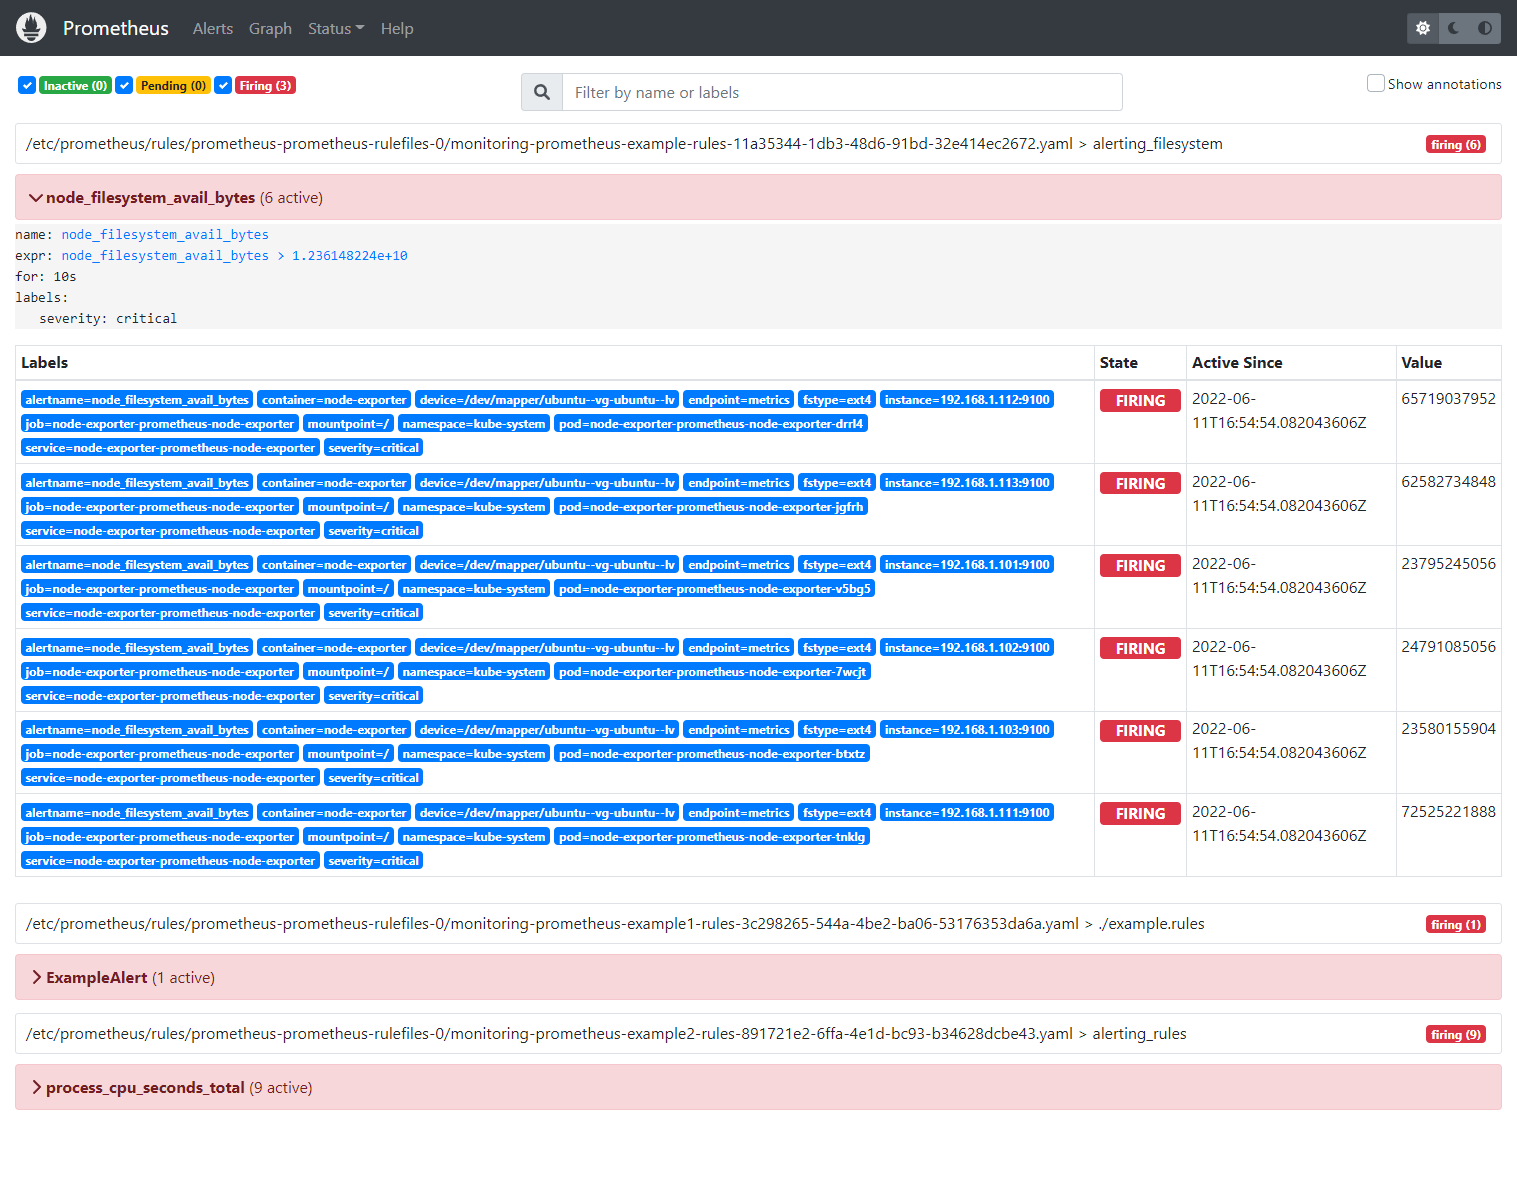
EOFPrometheus 서버 UI의 Rules 상태를 보면 alerting_filesystem 그룹 이름으로 alert rule이 등록 되었으며,
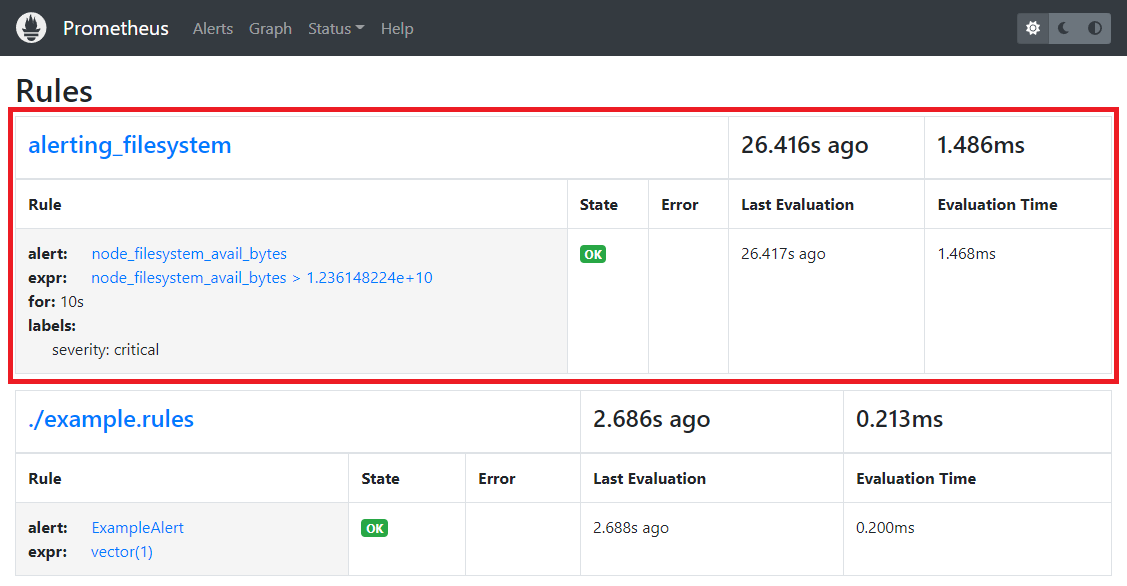
Alerts tab을 보면 node_filesystem_avail_bytes 지표에 대한 alert가 발생하고 있는 것을 볼 수 있습니다.
Step 3.6. AlertmanagerConfig
AlertmanagerConfig CR은 Alertmanager의 Alert rule을 바탕으로 Receiver로 Alert를 라우팅(route) 하여 OpsGenie, PagerDuty, Slack, webhook, Email, VictorOps, Pushover, SNS 그리고 Telegram으로 경고(alert)를 통보(notification)하고 금지 규칙(inhibit rule)의 설정을 custom resource로 정의하여 구성할 수 있습니다.
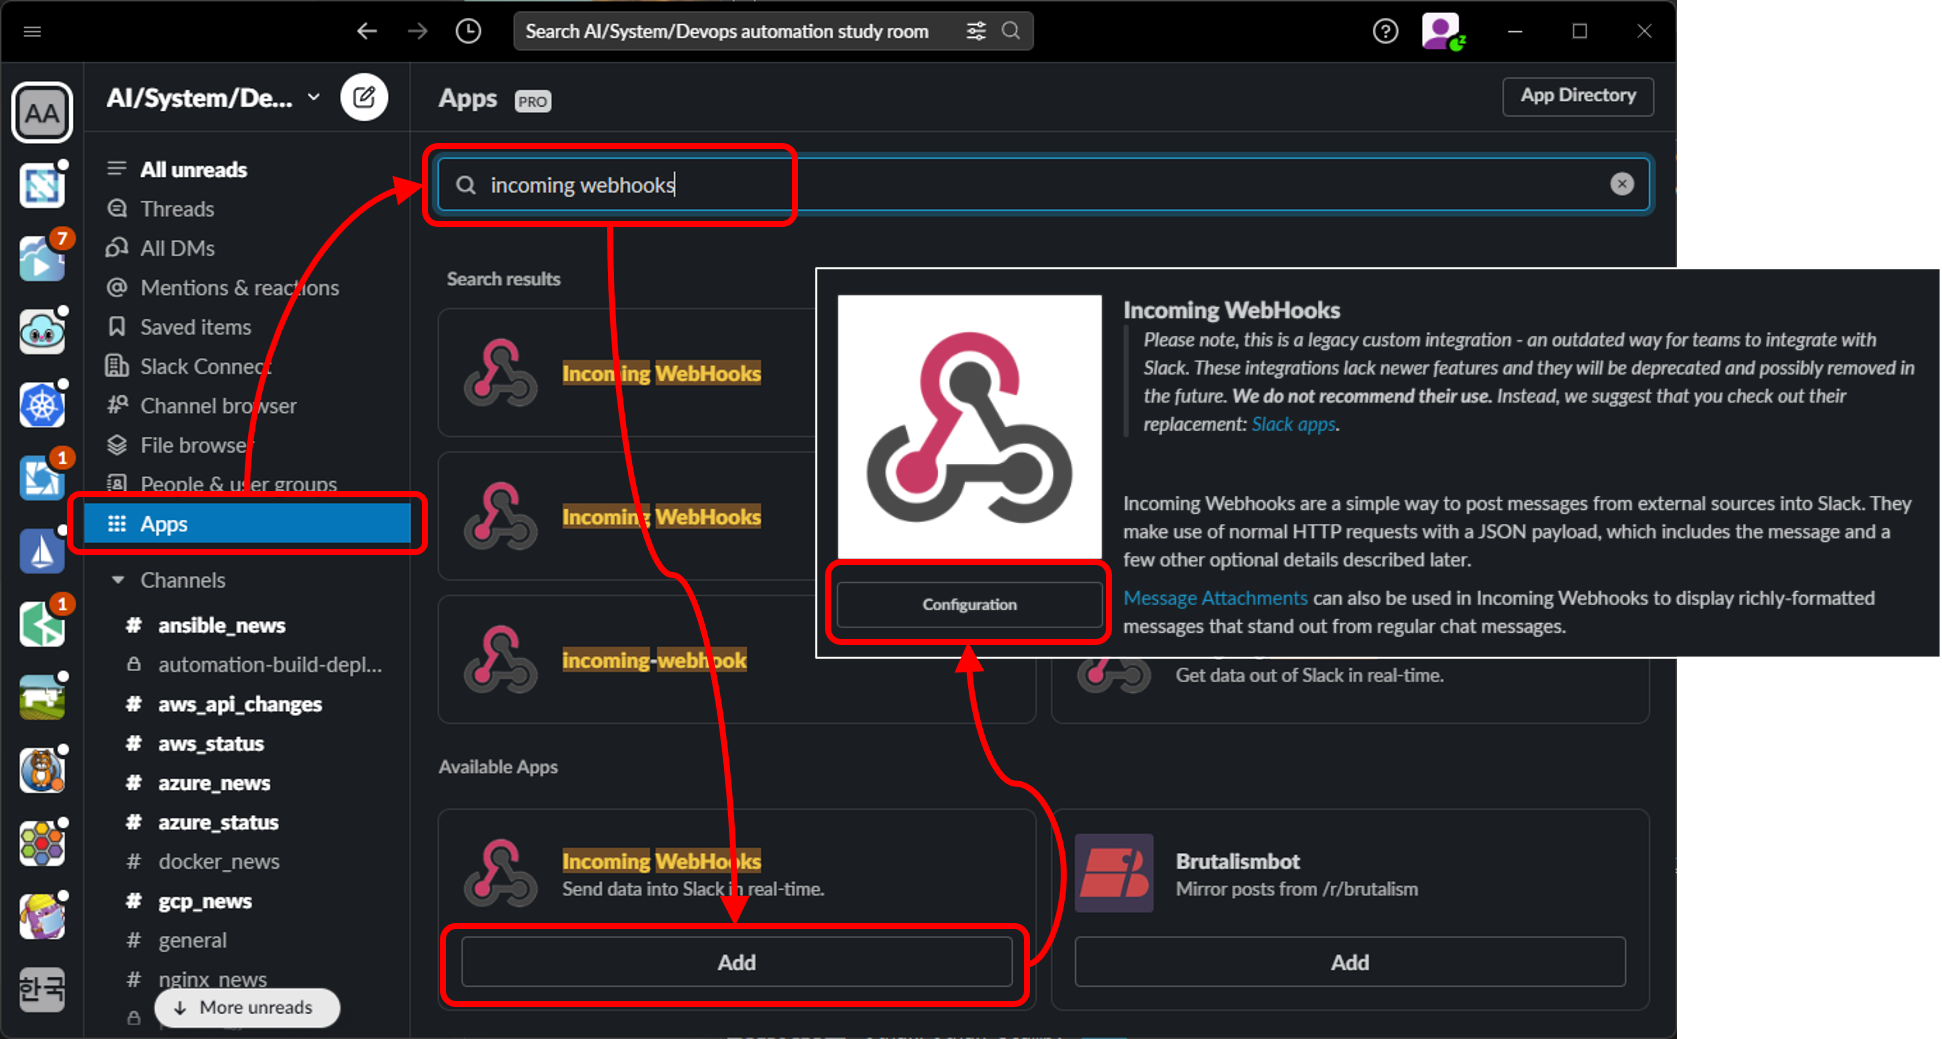
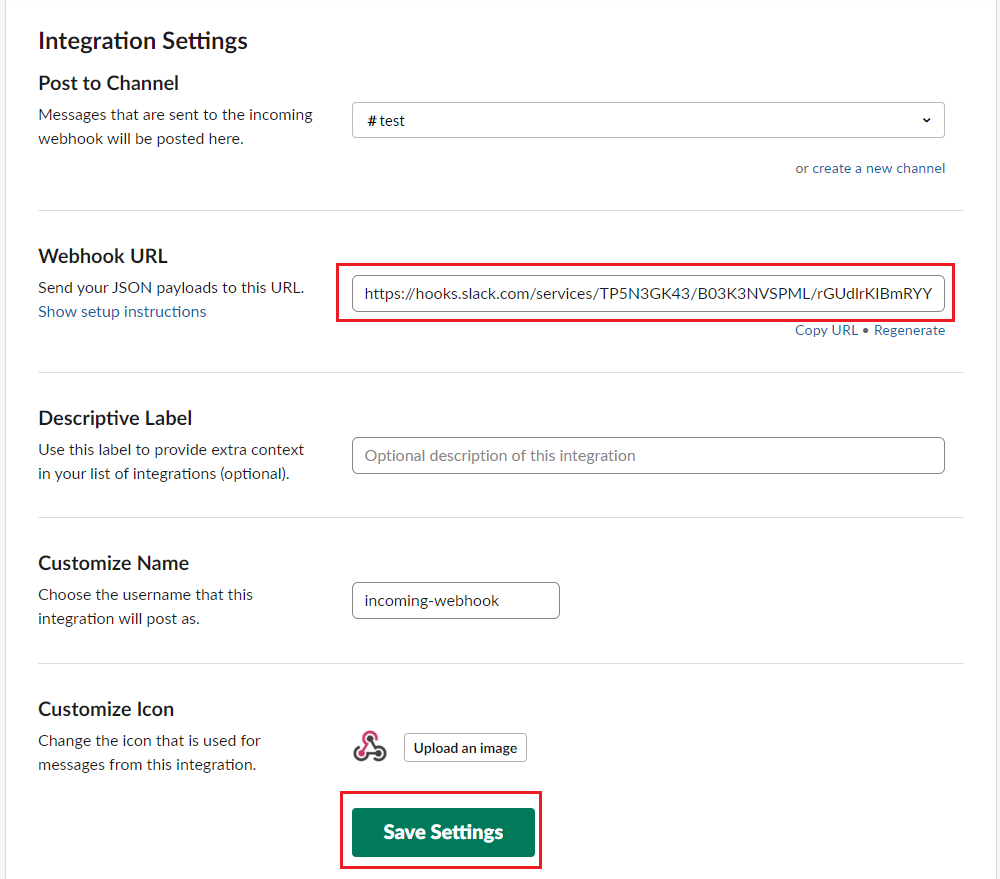
Alert를 Slack에 통보(notification)하는 방법에 대해 설명하겠습니다. Slack 채널에 alert를 보내기 위해 Incoming webhooks for Slack을 채널에 등록 합니다.
alert를 메세지를 보낼 Slack 워크스페이스에서 Incoming webhooks Apps을 등록 합니다.
경보(alert)를 보낼 채널을 선택하고 Incoming Webhooks을 등록 합니다.
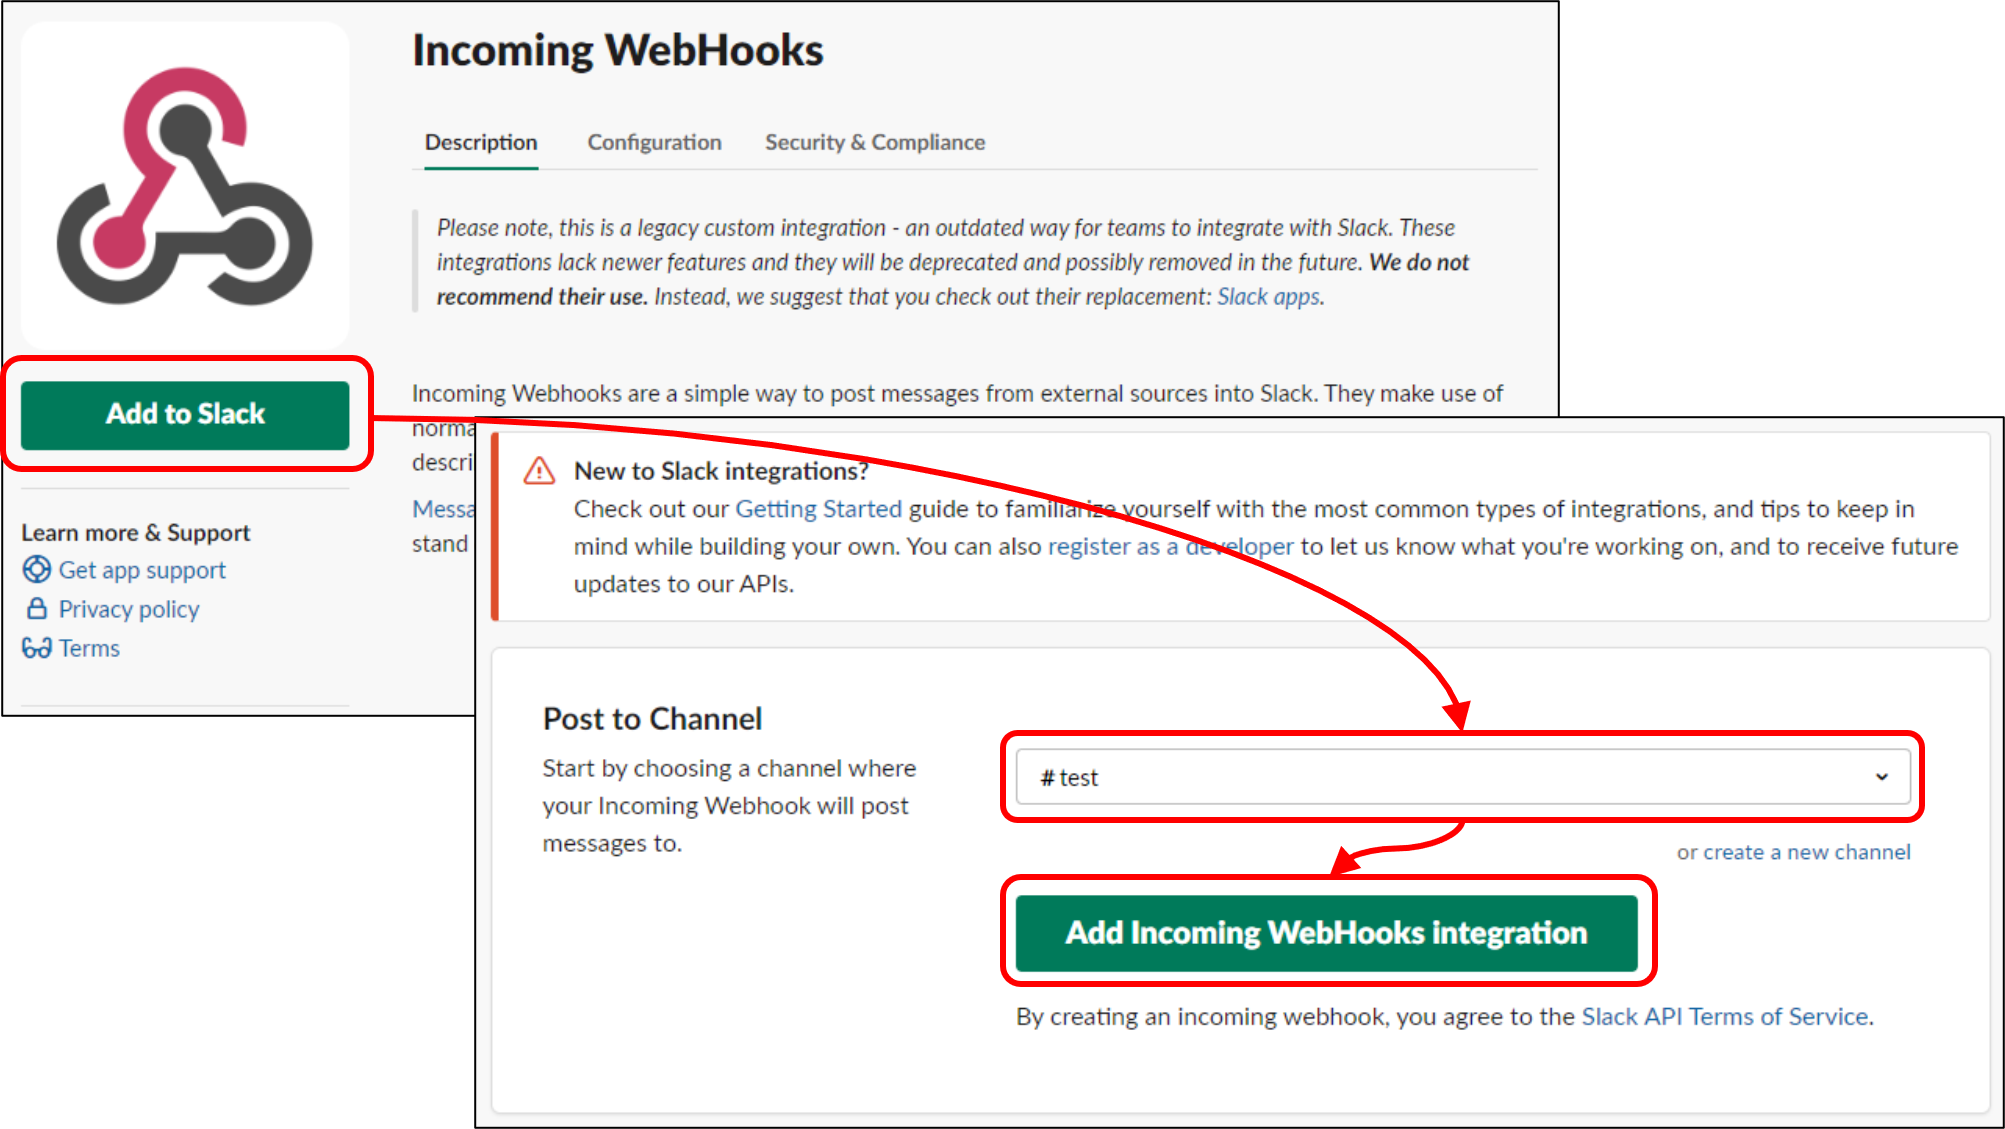
Webhook URL에는 nofication을 보낼 Slack 채널과 access token이 포함 되어 있으니 잘 보관합니다.
이제 AlertmanagerConfig CR을 생성 해보겠습니다.
$ cat <<EOF | kubectl apply -n monitoring -f -
apiVersion: monitoring.coreos.com/v1alpha1
kind: AlertmanagerConfig
metadata:
  labels:
    release: prometheus-operator
  name: slack-alertmanagerconfig
spec:
  receivers:
  - name: slack-nofications
    slackConfigs:
    - apiURL:
        key: token
        name: slack-webhook-url
        optional: false
      channel: '#test'
  route:
    groupBy:
    - severity
    groupInterval: 5m
    groupWait: 30s
    receiver: slack-nofications
    repeatInterval: 5m
EOF
Prometheus Operator가 Slack 채널에 접근 하기 위한 Slack 채널 URL과 접근 인증 정보를 Kubernetes Secret에 생성하며 참조하며, 이 Secret은 AlertmanagerConfig CR object와 동일한 네임스페이스에 있어야 합니다.
Slack 접속 정보를 을 위한 Secret을 생성에 앞서 위에서 언급한 Incoming Webhook URL을 Secret에 등록하기 위해 base64로 encoding하고 Secret을 생성합니다.
$ echo -e "https://hooks.slack.com/services/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" | base64
aHR0cHM6Ly9ob29rcy5zbGFjay5jb20vc2VydmljZXMvVFA1TjNHSzQzL0IwM0szTlZTUE1ML3JHVWRscktJQm1SWVliREVvYVJLR3FCZgo=
$ cat <<EOF | kubectl apply -n monitoring -f -
apiVersion: v1
kind: Secret
type: Opaque
metadata:
name: slack-webhook-url
data:
token: aHR0cHM6Ly9ob29rcy5zbGFjay5jb20vc2VydmljZXMvVFA1TjNHSzQzL0IwM0szTlZTUE1ML3JHVWRscktJQm1SWVliREVvYVJLR3FCZgo=
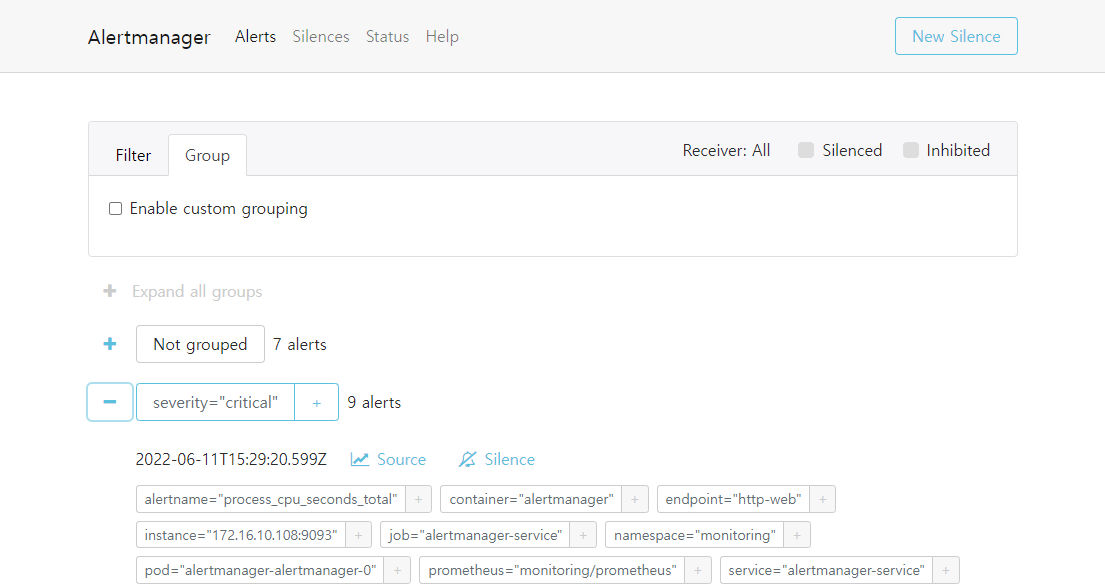
EOFAlertmanager Dashboard UI에 접속하면 Alert가 9개 trigger 되었네요.
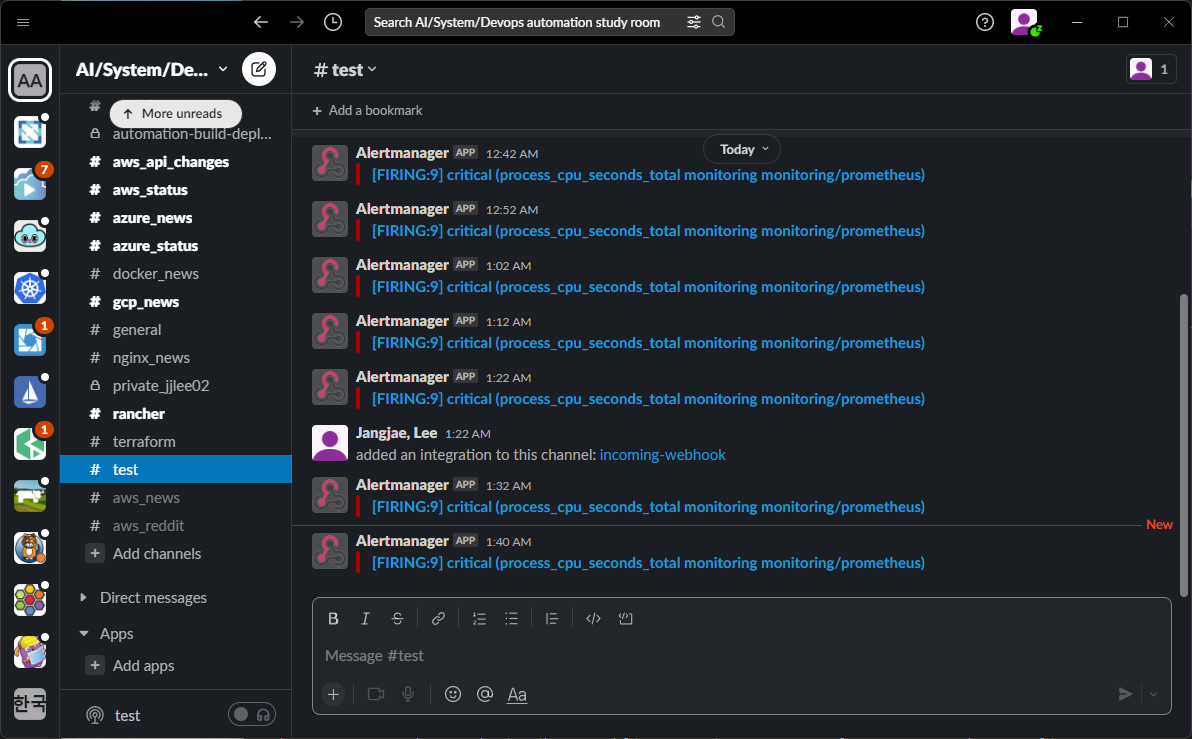
그리고 Slack 채널로 alert가 notification 된것도 확인할 수 있습니다.
추가로 Alertmanager CR 생성시 Alertmanager configuration은 같은 네임스페이스의 Kubernetes Secret으로 프로비저닝 됩니다.
$ kubectl describe secret/alertmanager-alertmanager-generated -n monitoring
Name:         alertmanager-alertmanager-generated
Namespace:    monitoring
Labels:       managed-by=prometheus-operator
Annotations:  <none>

Type:  Opaque

Data
====
alertmanager.yaml:  495 bytes
Secret의 내용을 보면 AlertmanagerConfiguration CR로 정의한 configuration이 설정 되어 있습니다.
$ kubectl get secret/alertmanager-alertmanager-generated -n monitoring -o jsonpath="{.data.alertmanager\.yaml}" | base64 -d
route:
  receiver: "null"
  routes:
  - receiver: monitoring/slack-alertmanagerconfig/slack-nofications
    group_by:
    - severity
    matchers:
    - namespace="monitoring"
    continue: true
    group_wait: 30s
    group_interval: 5m
    repeat_interval: 5m
receivers:
- name: "null"
- name: monitoring/slack-alertmanagerconfig/slack-nofications
  slack_configs:
  - api_url: https://hooks.slack.com/services/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
    channel: '#test'
templates: []
CRD 구성 파일의 유효성 검사를 자동화 할 수 있습니다.
자세한 사용 방법은 [링크]를 참조하세요.
- po-lint source : main.go
po-lint는 prometheus-operator의 api/monitoring/v1의 types을 사용하여 문법의 유효성 검사를 합니다.
- https://github.com/prometheus-operator/prometheus-operator/blob/main/pkg/apis/monitoring/v1/types.go
- https://github.com/prometheus-operator/prometheus-operator/blob/main/pkg/apis/monitoring/v1/thanos_types.go
-
ServiceMonitor for Alertmanager
apiVersion: monitoring.coreos.com/v1
kind: ServiceMonitor
metadata:
  labels:
    release: prometheus-operator
  name: alertmanager-servicemonitor
spec:
  endpoints:
  - path: /metrics
    port: http-web
  namespaceSelector:
    matchNames:
    - monitoring
  selector:
    matchLabels:
      release: prometheus-operator
-
ServiceMonitor for prometheus-node-exportor
apiVersion: monitoring.coreos.com/v1
kind: ServiceMonitor
metadata:
  labels:
    release: prometheus-operator
  name: prometheus-node-exporter-servicemonitor
spec:
  endpoints:
  - path: /metrics
    port: metrics
  namespaceSelector:
    matchNames:
    - kube-system
  selector:
    matchLabels:
      app: prometheus-node-exporter
      release: node-exporter
-
PorMonitor for kube-state-metric
apiVersion: monitoring.coreos.com/v1
kind: PodMonitor
metadata:
  labels:
    release: prometheus-operator
  name: kube-state-metric-podmonitor
spec:
  namespaceSelector:
    matchNames:
    - kube-system
  podMetricsEndpoints:
  - targetPort: 8080
  selector:
    matchLabels:
      app.kubernetes.io/component: metrics
      app.kubernetes.io/instance: kube-state-metrics
Website
GitHub
- https://github.com/prometheus-operator/prometheus-operator
- https://github.com/helm/charts/blob/master/stable/prometheus-operator/README.md Helm Charts Configuration의 설명이 자세함
- kube-prometheus
- kube-prometheus stack
Operator Hub
GO Packages
- https://www.infracloud.io/blogs/prometheus-operator-helm-guide/
- https://kubernetes.io/docs/tasks/manage-kubernetes-objects/declarative-config/#how-to-create-objects
- https://kubernetes.io/docs/reference/using-api/server-side-apply/
- https://medium.com/pareture/kubectl-install-crd-failed-annotations-too-long-2ebc91b40c7d
- https://grafana.com/docs/grafana-cloud/kubernetes/prometheus/prometheus_operator/
- https://alibaba-cloud.medium.com/kubernetes-cluster-monitoring-using-prometheusv-4fc77c971330
- https://operatorframework.io/operator-capabilities/
- https://www.nicktriller.com/blog/managing-prometheus-on-kubernetes-with-prometheus-operator/
- https://sysdig.com/blog/kubernetes-monitoring-prometheus-operator-part3/
- https://gurumee92.tistory.com/category/Monitoring/Prometheus
- https://www.youtube.com/watch?v=Uph_Say4D3M
END