MapLibre Examples - izudon/izudon.github.io GitHub Wiki
- Add comments on every example of MapLibre GL JS .
- Every title may link to my commentary page.
- Every banner will link to its official example page.
Index with image
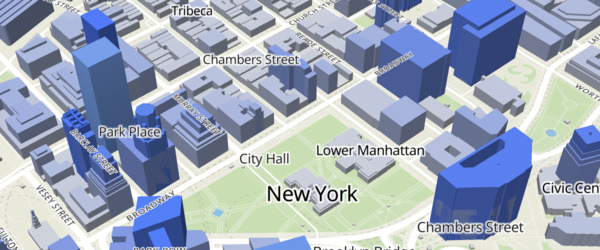
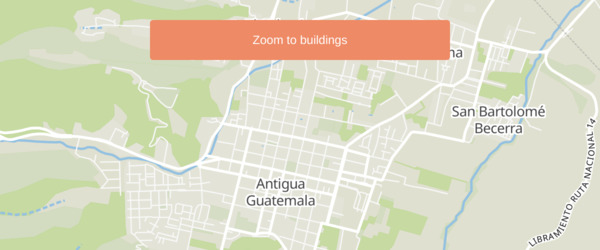
0010 Display buildings in 3D
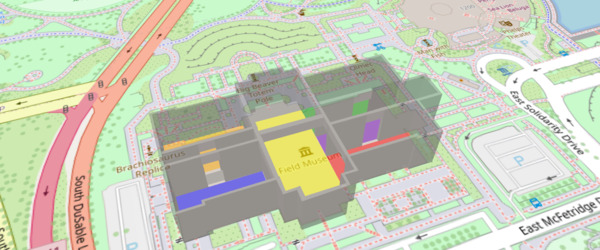
0020 Extrude polygons for 3D indoor mapping
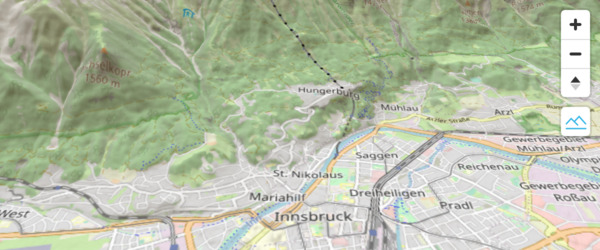
0030 3D Terrain
0040 Add a 3D model with babylon.js
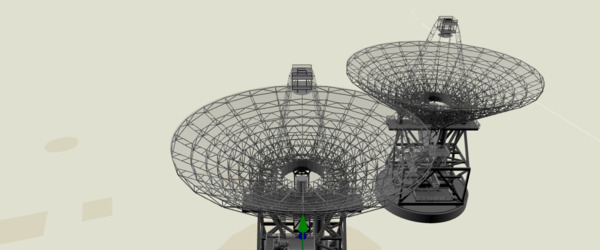
0050 Add a 3D model with three.js
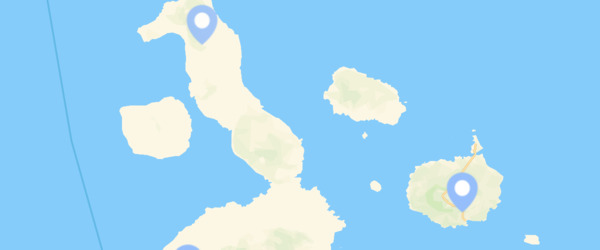
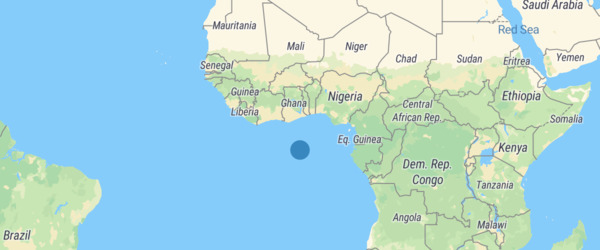
0060 Add a default marker
0070 Add an animated icon to the map
0080 Add a generated icon to the map
0090 Generate and add a missing icon to the map
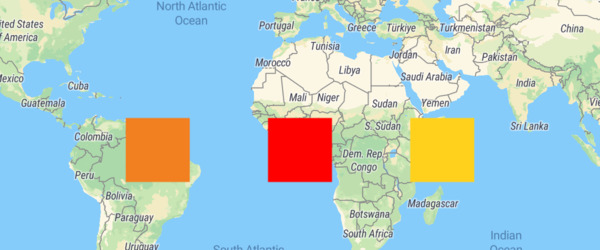
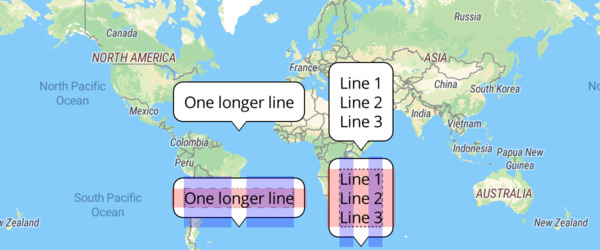
0100 Add a stretchable image to the map
0110 Add an icon to the map
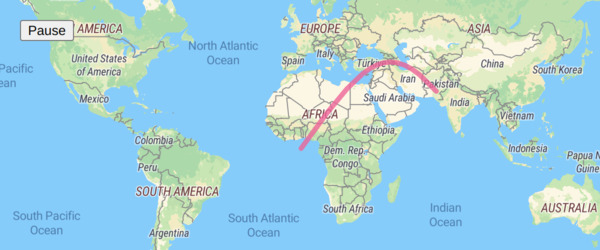
0120 Animate a line
0130 Animate map camera around a point
0140 Animate a series of images
0150 Animate a marker
0160 Animate a point
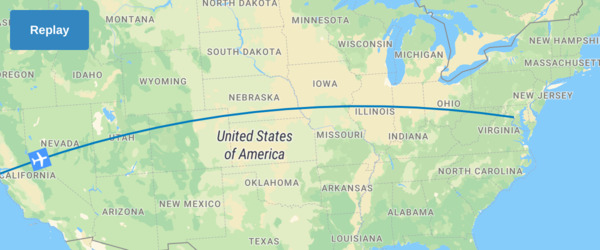
0170 Animate a point along a route
0180 Change the default position for attribution
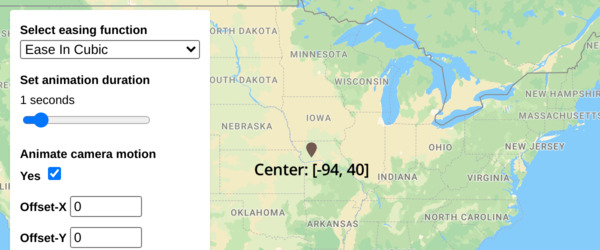
0190 Customize camera animations
0200 Add a canvas source
0210 Center the map on a clicked symbol
0220 Change building color based on zoom level
0230 Change the case of labels
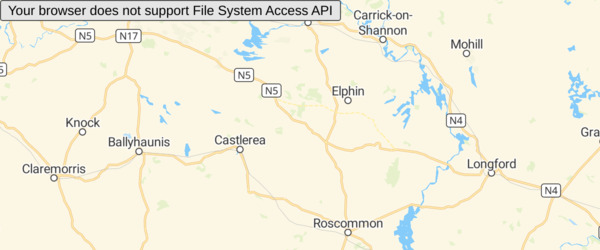
0240 Check if MapLibre GL JS is supported
0250 Display HTML clusters with custom properties
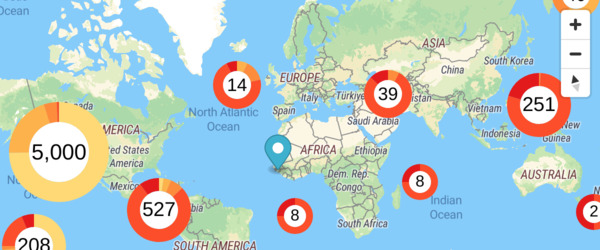
0260 Create and style clusters
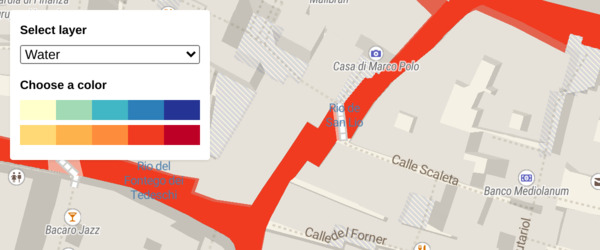
0270 Change a layer's color with buttons
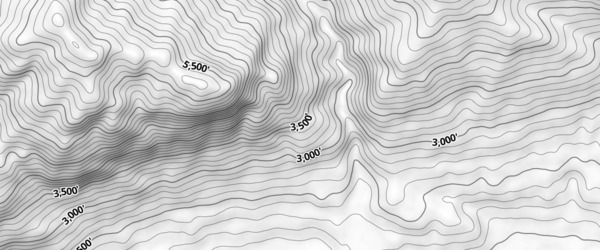
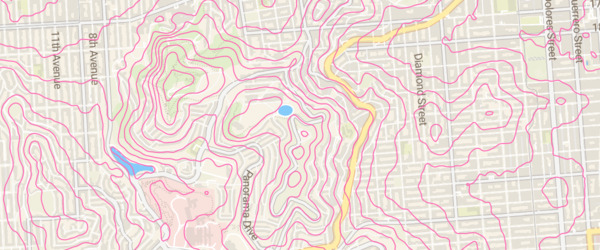
0280 Add Contour Lines
0290 Cooperative gestures
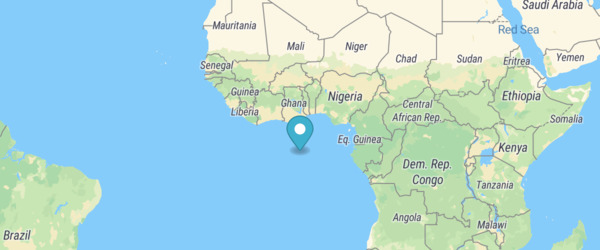
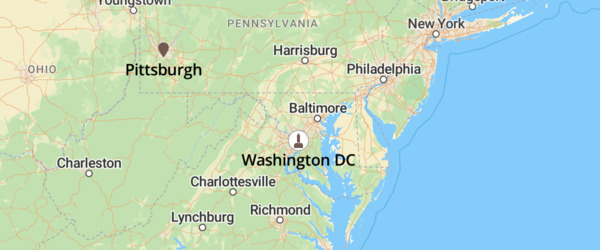
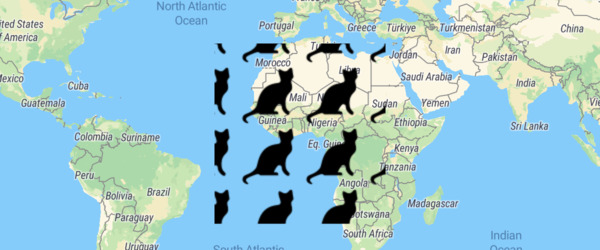
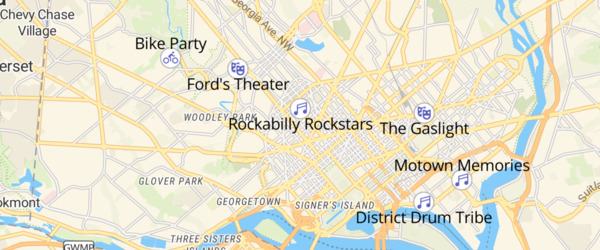
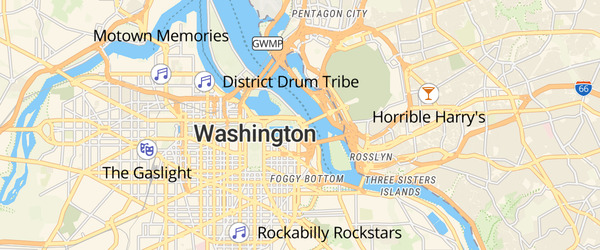
0300 Add custom icons with Markers
![]()
0310 Add a custom style layer
0320 Style lines with a data-driven property
0330 Disable map rotation

0340 Disable scroll zoom
0350 Display and style rich text labels
0360 Create a draggable Marker
0370 Create a draggable point
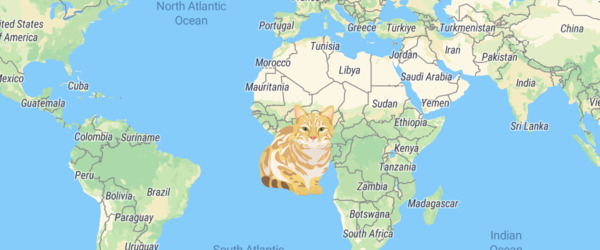
0380 Use a fallback image
0390 Add a pattern to a polygon
0400 Filter symbols by text input

0410 Filter symbols by toggling a list

0420 Fit a map to a bounding box

0430 Slowly fly to a location

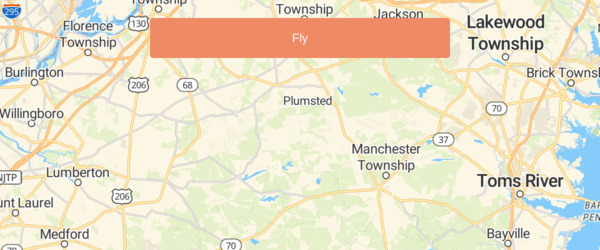
0440 Fly to a location
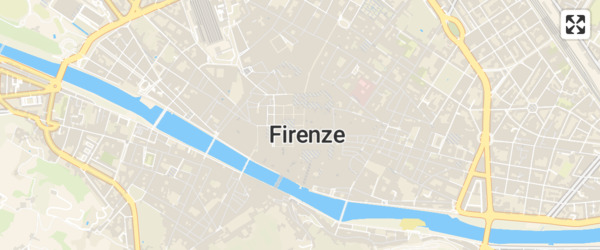
0450 View a fullscreen map
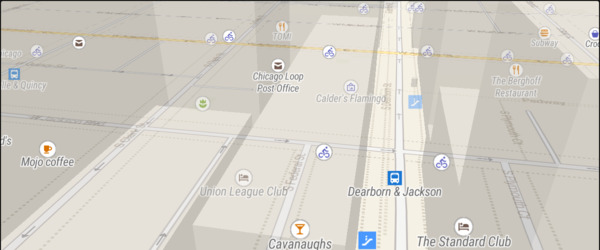
0460 Navigate the map with game-like controls
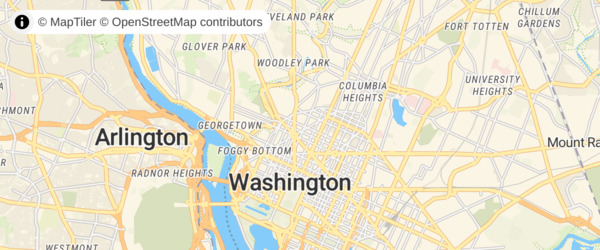
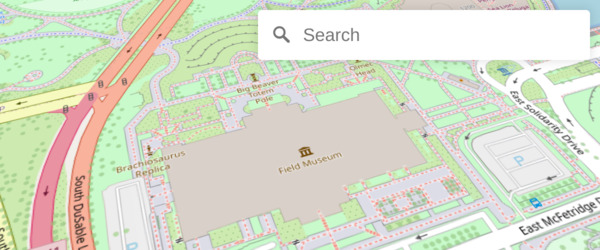
0470 Geocode with Nominatim
0480 Add a new layer below labels
0490 Add a GeoJSON line
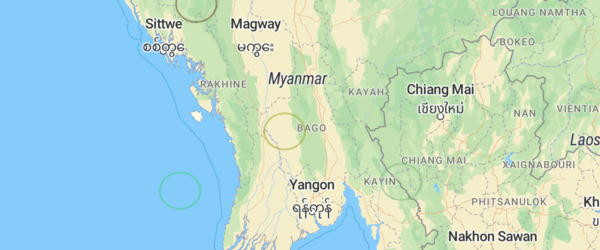
0500 Draw GeoJSON points
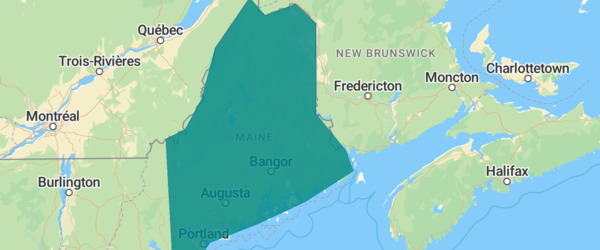
0510 Add a GeoJSON polygon
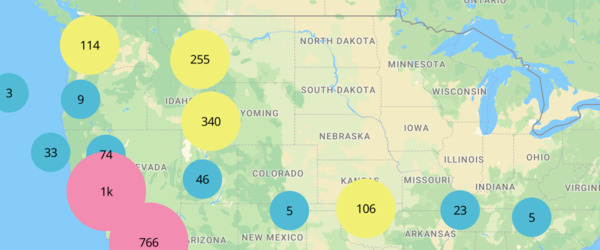
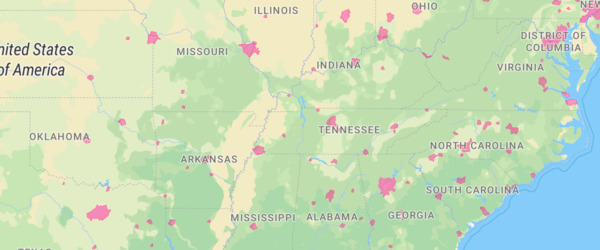
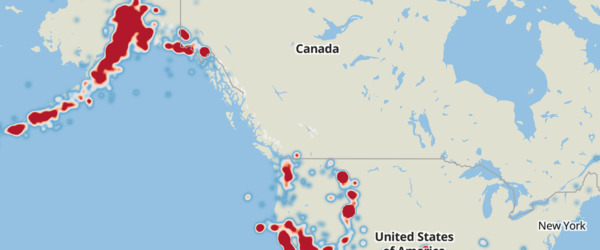
0520 Create a heatmap layer
0530 Create a hover effect
0540 Display a non-interactive map
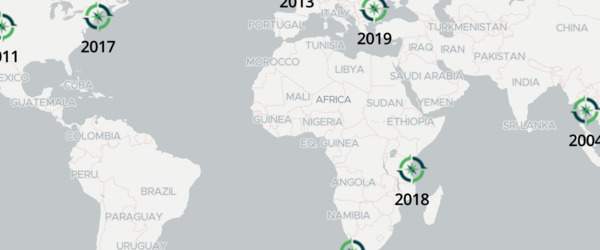
0550 Jump to a series of locations
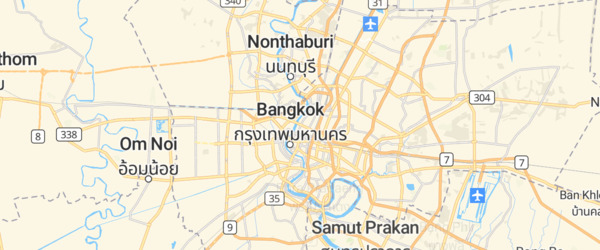
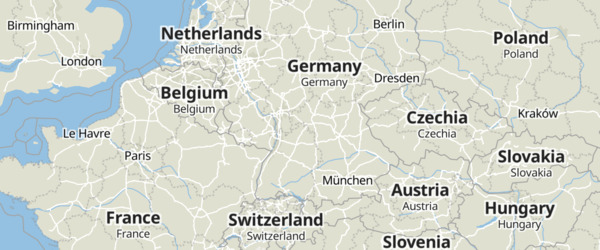
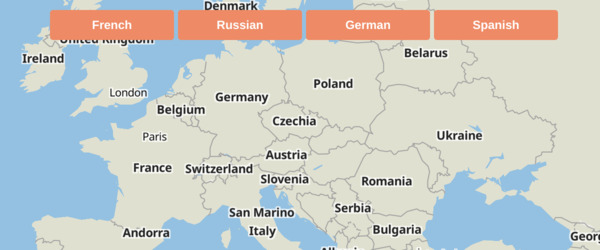
0560 Change a map's language
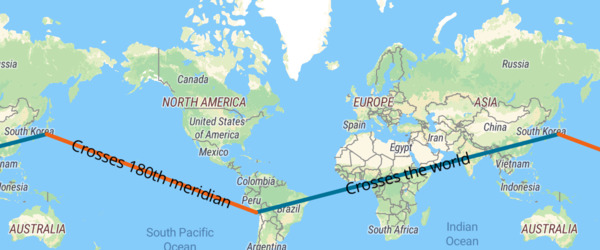
0570 Display line that crosses 180th meridian
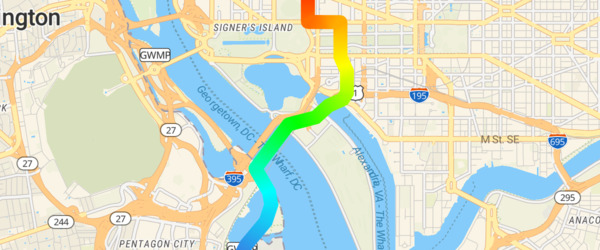
0580 Create a gradient line using an expression
0590 Add live realtime data
0600 Update a feature in realtime
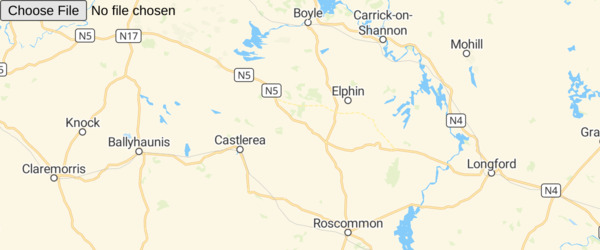
0610 View local GeoJSON (experimental)
0620 View local GeoJSON
0630 Use locally generated ideographs
0640 Locate the user
0650 Add a raster tile source
0660 Show drawn polygon area
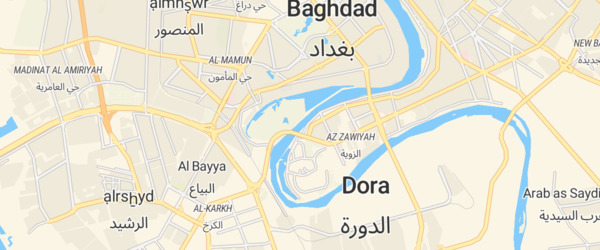
0670 Add support for right-to-left scripts
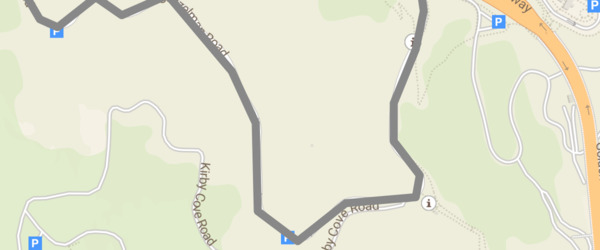
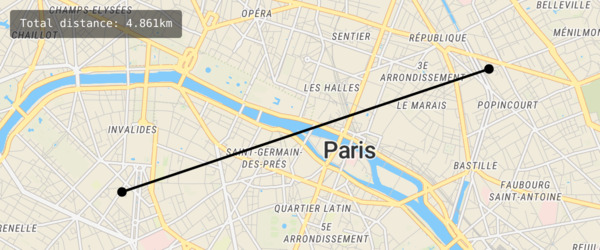
0680 Measure distances
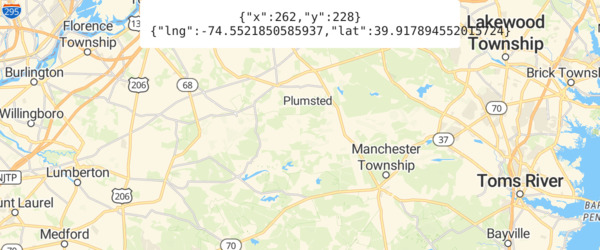
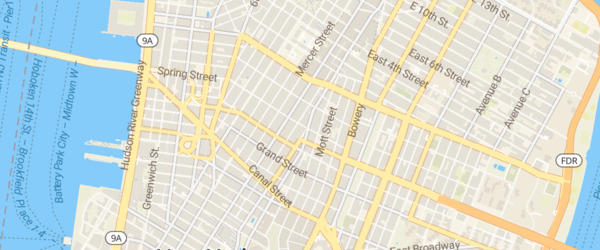
0690 Get coordinates of the mouse pointer
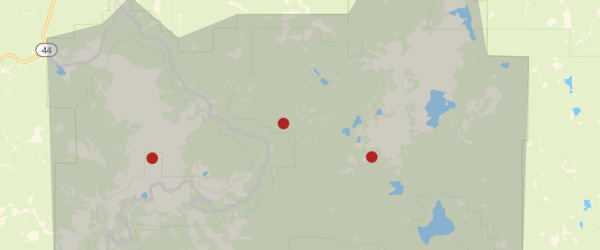
0700 Add multiple geometries from one GeoJSON source
0710 Display map navigation controls
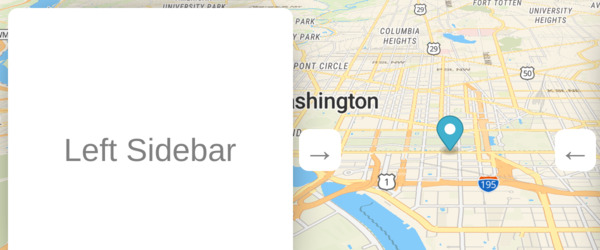
0720 Offset the vanishing point using padding
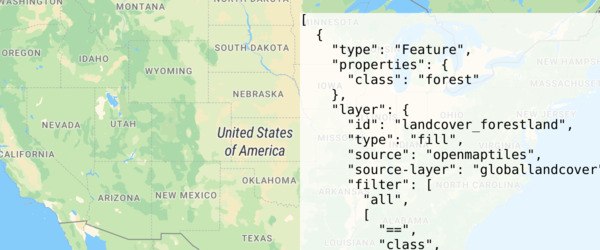
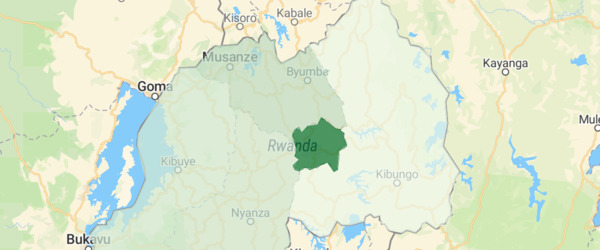
0730 Show polygon information on click
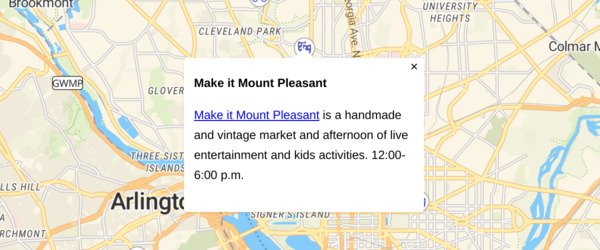
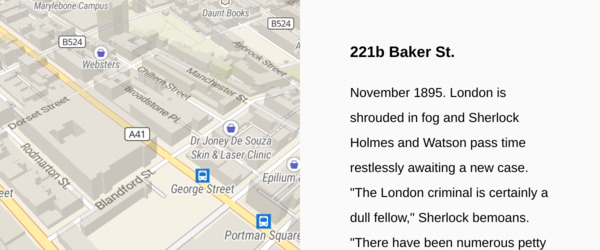
0740 Display a popup on click
0750 Display a popup on hover
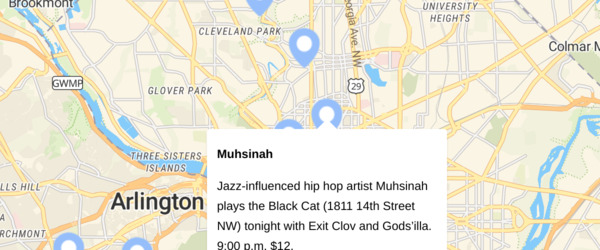
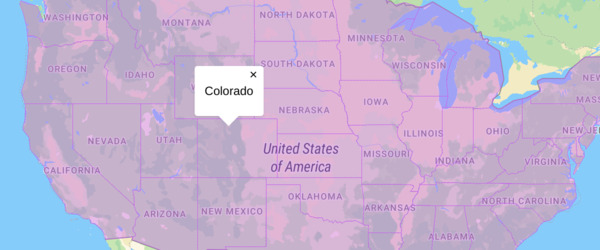
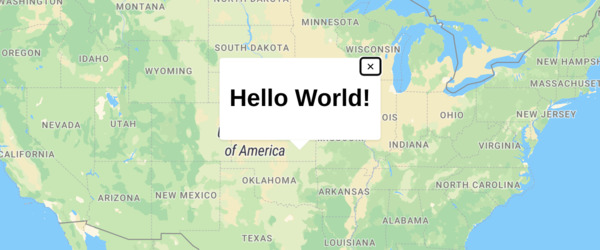
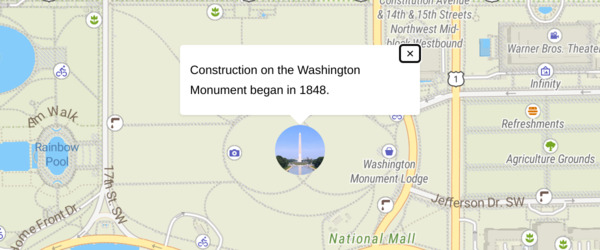
0760 Display a popup
0770 Get features under the mouse pointer
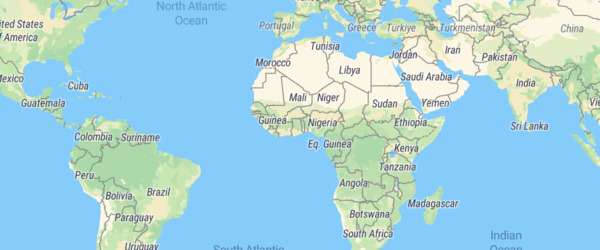
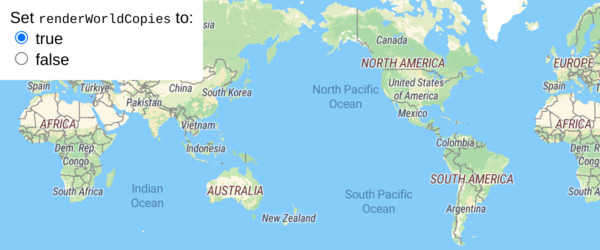
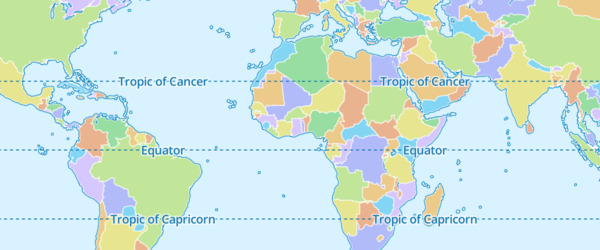
0780 Render world copies
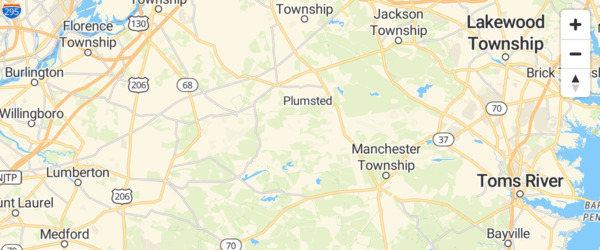
0790 Restrict map panning to an area
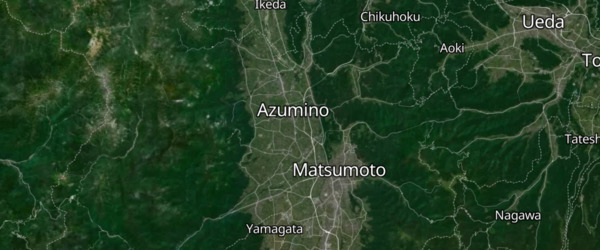
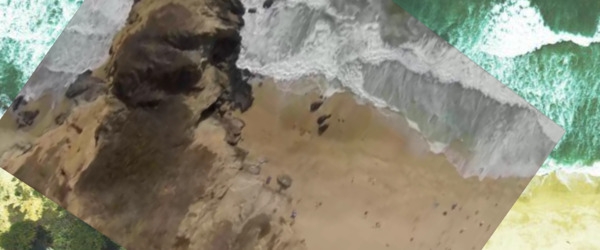
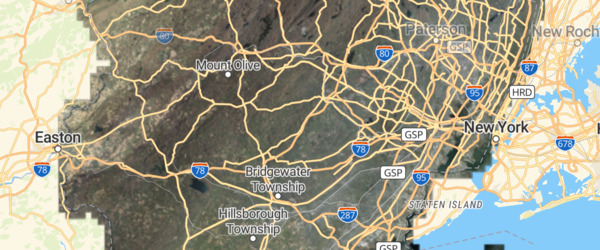
0800 Display a satellite map
0810 Fly to a location based on scroll position
0820 Set pitch and bearing
0830 Attach a popup to a marker instance
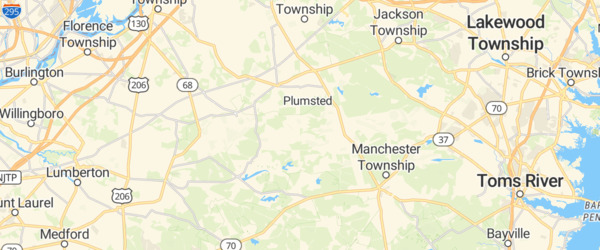
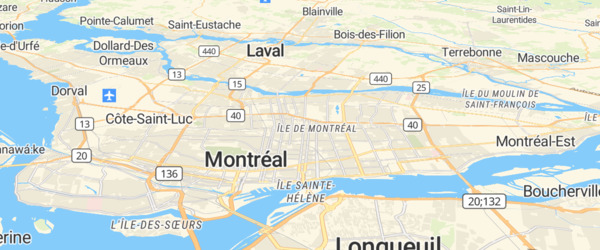
0840 Display a map
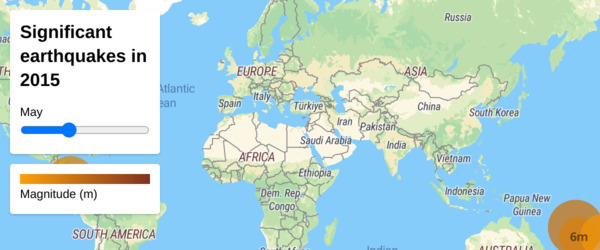
0850 Create a time slider
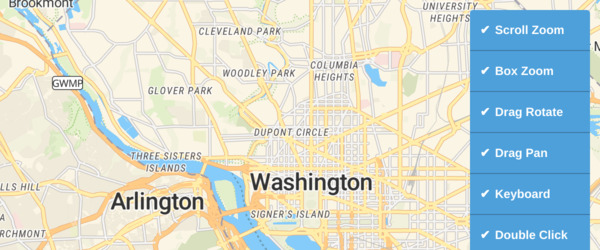
0860 Toggle interactions
0870 Variable label placement
0880 Variable label placement with offset
0890 Add a vector tile source
0900 Add a video
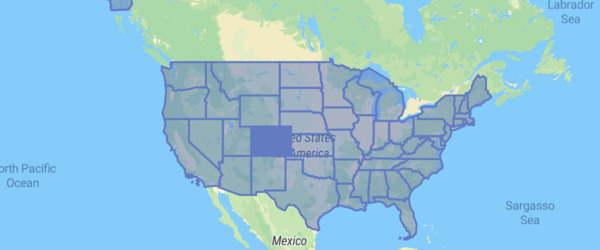
0910 Visualize population density
0920 Add a WMS source
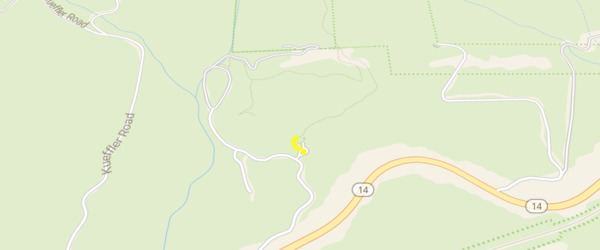
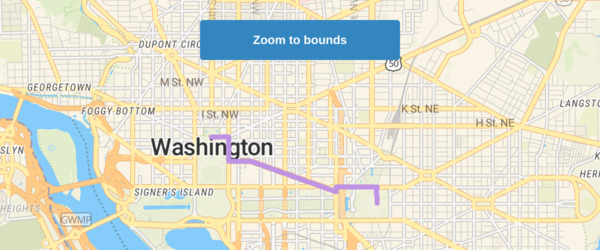
0930 Fit to the bounds of a LineString
Index
- Display buildings in 3D
- Extrude polygons for 3D indoor mapping
- 3D Terrain
- Add a 3D model with babylon.js
- Add a 3D model with three.js
- Add a default marker
- Add an animated icon to the map
- Add a generated icon to the map
- Generate and add a missing icon to the map
- Add a stretchable image to the map
- Add an icon to the map
- Animate a line
- Animate map camera around a point
- Animate a series of images
- Animate a marker
- Animate a point
- Animate a point along a route
- Change the default position for attribution
- Customize camera animations
- Add a canvas source
- Center the map on a clicked symbol
- Change building color based on zoom level
- Change the case of labels
- Check if MapLibre GL JS is supported
- Display HTML clusters with custom properties
- Create and style clusters
- Change a layer's color with buttons
- Add Contour Lines
- Cooperative gestures
- Add custom icons with Markers
- Add a custom style layer
- Style lines with a data-driven property
- Disable map rotation
- Disable scroll zoom
- Display and style rich text labels
- Create a draggable Marker
- Create a draggable point
- Use a fallback image
- Add a pattern to a polygon
- Filter symbols by text input
- Filter symbols by toggling a list
- Fit a map to a bounding box
- Slowly fly to a location
- Fly to a location
- View a fullscreen map
- Navigate the map with game-like controls
- Geocode with Nominatim
- Add a new layer below labels
- Add a GeoJSON line
- Draw GeoJSON points
- Add a GeoJSON polygon
- Create a heatmap layer
- Create a hover effect
- Display a non-interactive map
- Jump to a series of locations
- Change a map's language
- Display line that crosses 180th meridian
- Create a gradient line using an expression
- Add live realtime data
- Update a feature in realtime
- View local GeoJSON (experimental)
- View local GeoJSON
- Use locally generated ideographs
- Locate the user
- Add a raster tile source
- Show drawn polygon area
- Add support for right-to-left scripts
- Measure distances
- Get coordinates of the mouse pointer
- Add multiple geometries from one GeoJSON source
- Display map navigation controls
- Offset the vanishing point using padding
- Show polygon information on click
- Display a popup on click
- Display a popup on hover
- Display a popup
- Get features under the mouse pointer
- Render world copies
- Restrict map panning to an area
- Display a satellite map
- Fly to a location based on scroll position
- Set pitch and bearing
- Attach a popup to a marker instance
- Display a map
- Create a time slider
- Toggle interactions
- Variable label placement
- Variable label placement
- Add a vector tile source
- Add a video
- Visualize population density
- Add a WMS source
- Fit to the bounds of a LineString