Travelling screen - ivancrg/vis.it GitHub Wiki
Third part of application is the travelling part which follows users during their transit from home to destination. Some functionalities of this component are: displaying local time and time of arrival, weather forecast for destination and finally, the last feature is music with the possibility of implementing suggestions based on destination, time and weather.
First feature we decided to develop before actual travelling screen is list of all planned trips. In user profile interface button "My trips" is added below "Change password" button. After users click on it, button redirects them to list of all trips planned by logged in user. Interface which displays that list is shown in picture below.

List of trips was implemented through recycler view which is explained in "Explore screen" page in more details.
For each trip in list users can click on button "View details". It redirects them to the following screen:


Main screen of the "On the go" section shows the destination that the user is heading to as well as his current position. Also, the current trip progress is shown (for full implementation home coordinates need to be provided from the database - we have to implement that). Upon starting the fragment, the application will check whether it has been granted the access to the device's location as well as whether the GPS is turned on. If any of mentioned things is missing, the app will prompt the user in order to correct the problem. Picture showing main travelling screen is located below this text.

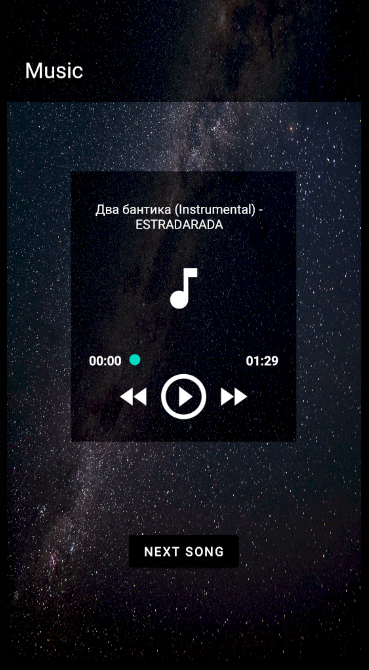
This part of the travelling screen gives the user a chance to listen to 20 different songs that are in the top-recommended music from the Shazam app. The API used for the feature lists different songs each week. The code that accesses Shazam API is shown below:
        OkHttpClient client = new OkHttpClient().newBuilder()
                .build();
        Request request = new Request.Builder()
                .url("https://shazam.p.rapidapi.com/songs/list-recommendations?key=SHA_KEY")
                .method("GET", null)
                .addHeader("X-RapidAPI-Key", "API_KEY")
                .addHeader("X-RapidAPI-Host", "shazam.p.rapidapi.com")
                .build();
After accessing the API and reading the JSON answer, variable "track" gets the url for the song which is than parsed into MediaPlayer, as shown below:
        JSONObject song = musicArr.getJSONObject(rand);
        track = song.getJSONObject("hub").getJSONArray("actions")
                .getJSONObject(1).getString("uri");
        MediaPlayer player = MediaPlayer.create(getContext(), Uri.parse(track));
The layout for music feature is shown on the image below.
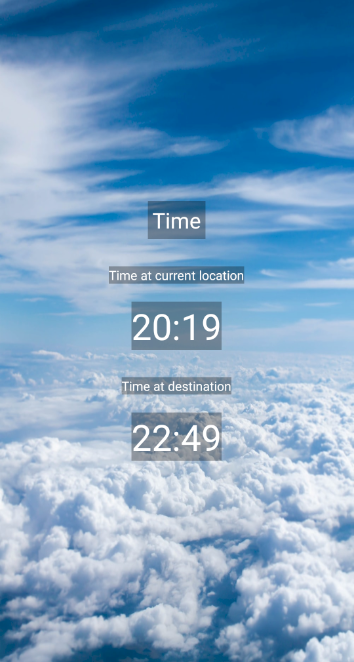
This part of the travelling screen gives the user information about the time at the current location following the user during travelling, and the destination city. Time at the current location is accessed through the user's phone location, and the destination time is gathered from destination latitude and longitude saved in the "My trips" part of the app and then forwarded to this part of the app.
Getting exact time at latitude and longitude is done in the method "private void getTimeZoneAPI()" which uses TimeZoneDB API. Since the variable "destinationTime" textview is created in the main thread, the only way to change the text inside it is by calling the runOnUiThread method. So the code for the destination time feature is as follows:
JSONObject timeObject = new JSONObject(myResponse);
time = timeObject.get("formatted").toString();

getActivity().runOnUiThread(new Runnable() {
      @Override
      public void run() {
             if (time.length() > 10){
                   destinationTime.setText(time.substring(time.length() - 8, time.length() - 3));
             } else {
                   destinationTime.setText("unavailable");
             }
      }
});
TextBox which displays time is updated through the timer which has to be stopped in case the user exists this fragment, therefore it is crucial to implement following function in the TimeFragment class.
@Override
    public void onDetach(){
        super.onDetach();
        timer.cancel();
    }
The layout of the time feature is shown in the image below.
This part of the "On the go" section of the application can be used to check what are the weather conditions at the destination we are travelling to.
The most time-consuming part of creating weather feature was designing a model that would reflect JSON file structure that OpenWeatherMap Onecall API offers. We used Online JSON Viewer for visualizing the received JSON response and it helped us really much in creating the model. The two pictures below show the difference visualization makes.


Model created with the help of visualization is shown on the picture below.

OpenWeatherMap API data is downloaded using Retrofit2 which also (when correctly configured) automatically populates the previously created weather model using received data. The process is very similar to the process of communicating with vis.it API - we won't go into further details since the explanation can be found on other Wiki pages with similar examples. Code for downloading data and populating weather models is attached below.
   private void downloadWeatherData() {
        Retrofit retrofit = OpenWeatherMap.getRetrofit();
        OpenWeatherMapAPI openWeatherMapAPI = retrofit.create(OpenWeatherMapAPI.class);
        Call<WeatherData> call = openWeatherMapAPI.getWeatherData(lat, lon, OpenWeatherMap.getApiKey(), OpenWeatherMap.UNITS.METRIC);

        call.enqueue(new Callback<WeatherData>() {
            @Override
            public void onResponse(@NotNull Call<WeatherData> call, @NotNull Response<WeatherData> response) {
                if (!response.isSuccessful()) {
                    // Not OK
                    Log.e("/getWeatherData", "notSuccessful: Something went wrong. " + response.code());
                    Toast.makeText(getContext(), "Sorry, the weather forecast is not available.", Toast.LENGTH_SHORT).show();
                    return;
                }

                assert response.body() != null;
                WeatherData weatherData = response.body();

                // Display name of destination city
                location.setText(destinationCity);

                // Making sure that the first letter of the description is always
                // upper case and all the other letters lower case
                String desc = Character.toUpperCase(weatherData.getCurrentWeatherData().getWeatherDescription().get(0).getDescription().charAt(0))
                        + weatherData.getCurrentWeatherData().getWeatherDescription().get(0).getDescription().substring(1).toLowerCase();

                // Display current weather conditions
                description.setText(desc);
                temperature.setText(String.format("%s°C", weatherData.getCurrentWeatherData().getTemperature().toString()));
                humidity.setText(String.format("%s%%", weatherData.getCurrentWeatherData().getHumidity().toString()));
                pressure.setText(String.format("%shPa", weatherData.getCurrentWeatherData().getPressure().toString()));
                windSpeed.setText(String.format("%sm/s", weatherData.getCurrentWeatherData().getWindSpeed().toString()));
                windDirection.setText(String.format("%s°", weatherData.getCurrentWeatherData().getWindDirection().toString()));


                // Display image according to weather conditions
                icon = weatherData.getCurrentWeatherData().getWeatherDescription().get(0).getIconID();

                switch (icon) {
                    case "01d":
                        image.setImageResource(R.drawable.weather_icon_sun);
                        break;
                    case "01n":
                        image.setImageResource(R.drawable.weather_icon_moon);
                        break;
                    case "02d":
                        image.setImageResource(R.drawable.weather_icon_sun_cloud);
                        break;
                    case "02n":
                        image.setImageResource(R.drawable.weather_icon_moon_cloud);
                        break;
                    case "03d":
                    case "03n":
                        image.setImageResource(R.drawable.weather_icon_cloud);
                        break;
                    case "04d":
                    case "04n":
                        image.setImageResource(R.drawable.weather_icon_cloud_foggy);
                        break;
                    case "09d":
                    case "09n":
                        image.setImageResource(R.drawable.weather_icon_cloud_more_rain);
                        break;
                    case "10d":
                        image.setImageResource(R.drawable.weather_icon_sun_cloud_rain);
                        break;
                    case "10n":
                        image.setImageResource(R.drawable.weather_icon_moon_cloud_rain);
                        break;
                    case "11d":
                        image.setImageResource(R.drawable.weather_icon_sun_cloud_thunder_rain);
                        break;
                    case "11n":
                        image.setImageResource(R.drawable.weather_icon_moon_cloud_thunder_rain);
                        break;
                    case "13d":
                    case "13n":
                        image.setImageResource(R.drawable.weather_icon_snow);
                        break;
                    case "50d":
                    case "50n":
                        image.setImageResource(R.drawable.weather_icon_foggy);
                        break;
                    default:
                        image.setImageResource(R.drawable.weather_icon_sun_cloud_drop);
                }

                createCharts(weatherData);
            }

            @Override
            public void onFailure(@NotNull Call<WeatherData> call, @NotNull Throwable t) {
                // Communication error, JSON parsing error, class configuration error...
                Log.e("/getWeatherData", "onFailure: Something went wrong. " + t.getMessage());
                Toast.makeText(getContext(), "Sorry, the weather forecast is not available.", Toast.LENGTH_SHORT).show();
            }
        });
}Received data is shown in UI according to the created layout file - fragment_travelling_weather.xml. Charts are created using AnyChart import. Code for creating "1h expected volume of precipitation" chart is shown below and since all the methods that create charts are extensively commented, we will not explain creation of charts into further details.
    // Creates chart 1 - 1h expected volume of precipitation
    private void createChart1(ArrayList<MinutelyForecastData> minutelyForecastData) {
        // Selecting chart 1 - without it, the last selected chart changes instead
        APIlib.getInstance().setActiveAnyChartView(chart1);

        // Cartesian system with column chart
        Cartesian cartesian = AnyChart.column();

        // Preparing data for binding to chart
        List<DataEntry> data = new ArrayList<>();
        for (MinutelyForecastData dataItem : minutelyForecastData) {
            data.add(new ValueDataEntry(dataItem.getTimeHHmm(), dataItem.getPrecipitationVolume()));
        }

        // Adding data to the chart system
        Column column = cartesian.column(data);

        // Defining preferences when a column is selected
        column.tooltip()
                // {%X} - X value of selected column
                .titleFormat("Expected at {%X}")
                .position(Position.CENTER_BOTTOM)
                .anchor(Anchor.CENTER_BOTTOM)
                .offsetX(0d)
                .offsetY(0d)
                // {%Value} - Y value of selected column
                .format("Expected precipitation volume: {%Value}{groupsSeparator: }mm");

        // Starting animation
        cartesian.animation(true);

        cartesian.title("1h volume of precipitation");

        // Scale of y - minimum and maximum Y values (selected to minimum span)
        cartesian.yScale().minimum(0d);

        // Labels along y axis
        cartesian.yAxis(0).labels().format("{%Value}{groupsSeparator: }mm");

        // Zoom, interactivity, horizontal scrolling
        cartesian.tooltip().positionMode(TooltipPositionMode.POINT);
        cartesian.interactivity().hoverMode(HoverMode.BY_X);
        cartesian.xScroller(true);
        OrdinalZoom xZoom = cartesian.xZoom();
        xZoom.setToPointsCount(6, false, null);
        xZoom.getStartRatio();
        xZoom.getEndRatio();

        // Axis titles
        cartesian.xAxis(0).title("Time");
        cartesian.yAxis(0).title("Volume");

        // Placing the configured system to wanted chart
        chart1.setChart(cartesian);

        // Setting the linear layout that wraps the chart to visible
        linearLayout1.setVisibility(View.VISIBLE);
}Screenshot showing the weather feature is shown below.

Travelling screen milestone was implemented by:
- Hana Rut Lerga
- Ivan Rubinić
- Ivana Štimac