Analyzing x64 and x86 executables - itzjac/cpplearning GitHub Wiki
This section is completely optional and exclusive to Windows.
We provide the tools and methods to use AT&T (Linux default) and Intel (Windows default) syntax inside Windows. Similar approach can be followed if running in Linux. That's left as an exercise.
Reviewing the process to compile a program
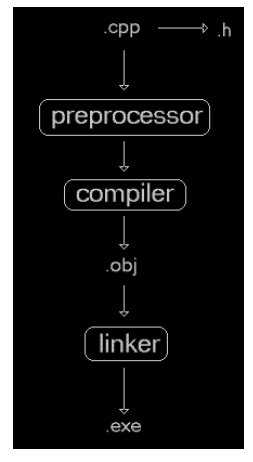
we will analyze the assembly code generated through the obj files. This process known as dissassembly because we are recovering from a binary file, the obj, the assembly code that was generated to produce it. We keep using the objdump command as in previous lesson.
Pre-processed files contain same results for both platforms.
# 1 "main.cpp"
# 1 "<built-in>"
# 1 "<command-line>"
# 1 "main.cpp"
int main()
{
    return 0;
}
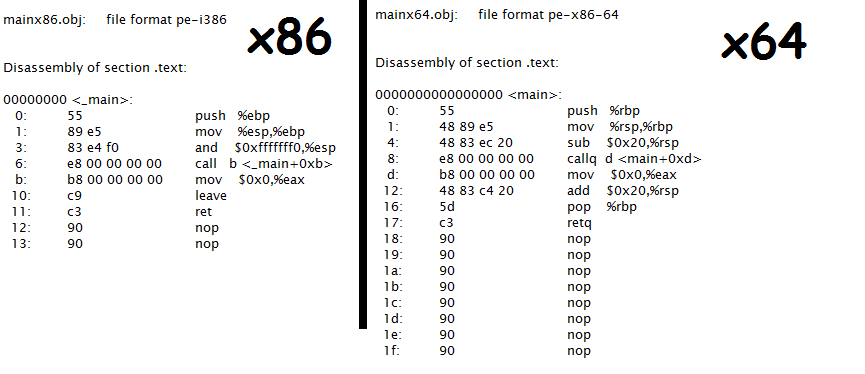
Disassembled objs.
Skimming through the assembly code.
-
Save a BasePointer BP in a stack, when entering to the main scope (EBP and RBP respectively)
-
Assign the new BP with the current StackPointer SP (ESP, RSP respectively)
-
BP <= SP, remember with AT&T syntax the assignation is done on the right side
-
The SP is aligned to a memory address (which can vary on different compilers)
-
ESP is aligned to multiple of 16 addresses
-
RSP allocates 32 bytes of memory, which is also done in order to align to multiple of 32 addresses
-
Executes next instruction after the CALL with realignment in place. Intel manual E8 opcode IntelManual opcodes page 180 the E8 cd opcode (the opcode E8 00 00 00 00 is 5 bytes long). A great explanaition on how to interpret opcode using Intel manuals Instruction-Encoding-Revealed-Bit-Twiddling
a. In x86 the relative address to main is a 1 byte number + 1 byte of offset: the result is specified in E8 like => E8 00 00 00 0B b. In x64 the relative address is a 2 byte number+ 1 byte of offset: the result is specified in E8 => E8 00 00 00 0D
-
The EAX register is cleaned with zero, that's our return value in main (as an experiment, change the return value which will definitely be reflected in this section of the asm, remember that returning any other number than zero from main, is considered an abnormal termination or an error code)
-
Finally when leaving the function, ret
-
In x86, leave instruction restores the stack frame SP<=BP and returns from this call by restoring a previously saved EIP
-
RSP releases 32 bytes of memory those needed for the alignment, pops from the stack pointer BP resulting in SP<=BP and returns from this call by restoring a previously saved EIP
A notorious difference is in the step 3, where the RSP allocates 32 bytes of memory (0x20 in hexadecimal) while ESP perfoms an AND operation to achieve similar behavior. This alignment specifications can be found in the www.x86-64.org section 3.2.2 Stack Frame. The goal of both alignments, ESP and RSP, is to provide memory alignment in one case a 16 byte and in the other a 32 byte alignment. Not all compilers follow this specifications, be aware you will find different types of alignments for other compilers.
Another notorious difference is the executables sizes
x64 129Kb
x86 102Kb
Can you answer without further analyzing the dissassembled code why this happens?
#include <iostream>
int main()
{
    std::cout<<"Comparing platforms"<<std::endl;
    return 0;
}
Pre-processor files are now using different libraries, therefore

Dissasembled objs

And lastly the executables sizes will again show differences.
x64 2.645Kb
x86 1,583Kb
Answering the question in previous analysis, remember that the size of pointers on each architecture and different, 4 bytes and 8 bytes respectively, this can add up quickly and
is obviously reflected in the resulting executable.
If you feel annoyed by the AT&T syntax (I did), it is possible to switch to the Intel syntax --disassembler-options=intel. Add this option in your bat file where the objdump is produced.
objdump -D --disassembler-options=intel main"%platformname%".obj > main"%platformname%".asm
The resulting asm.
mainx64.obj:     file format pe-x86-64
Disassembly of section .text:
0000000000000000 <main>:
   0:	55                   	push   rbp
   1:	48 89 e5             	mov    rbp,rsp
   4:	48 83 ec 20          	sub    rsp,0x20
   8:	e8 00 00 00 00       	call   d <main+0xd>
   d:	48 8d 15 00 00 00 00 	lea    rdx,[rip+0x0]        # 14 <main+0x14>
  14:	48 8b 0d 00 00 00 00 	mov    rcx,QWORD PTR [rip+0x0]        # 1b <main+0x1b>
  1b:	e8 00 00 00 00       	call   20 <main+0x20>
  20:	48 8b 15 00 00 00 00 	mov    rdx,QWORD PTR [rip+0x0]        # 27 <main+0x27>
  27:	48 89 c1             	mov    rcx,rax
  2a:	e8 00 00 00 00       	call   2f <main+0x2f>
  2f:	b8 00 00 00 00       	mov    eax,0x0
  34:	48 83 c4 20          	add    rsp,0x20
  38:	5d                   	pop    rbp
  39:	c3                   	ret
g++ contains 4 levels of optimization levels, o0 to o3. Let's look how the optimized code level -O3 specified through the g++ command line. We will generate optimized assembly code for the following program.
#include <iostream>
int main()
{
    std::cout<<"Optimization flag"<<std::endl;
    return 0;
}
To generate the level -O3 of optimization the g++ needs to use the following syntax
BATCH
g++ -c -O3 main.cpp -o main.obj
objdump  -D --disassembler-options=intel main.obj > main.asm
g++ -o main.exe main.obj
From the Switching Platform section in the previous chapter, you can extend this lines to create an script to generate both x86 and x64.
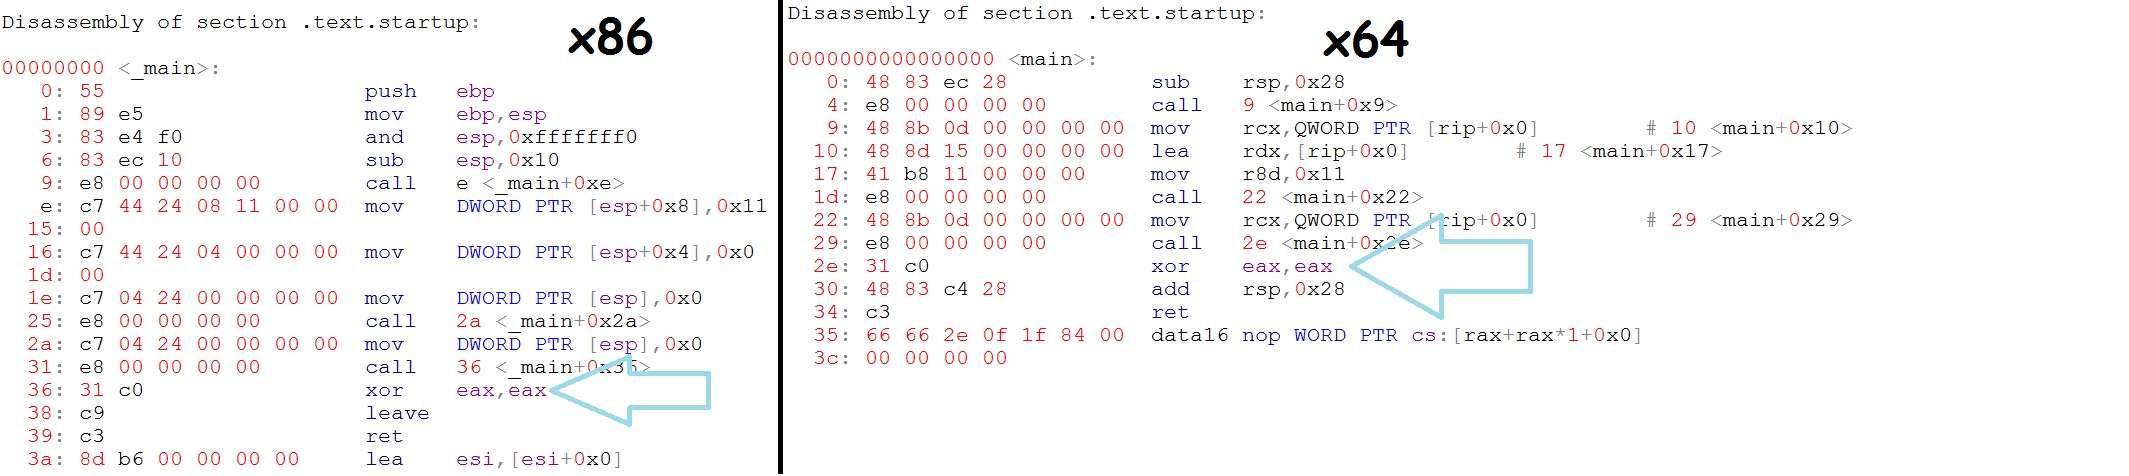
For such a short program, we can easily identify an optimization at assembly level. The operation mov eax, 0x0 5 bytes size, is replaced with xor eax, eax, 2 bytes size. A rule of thumb is optimized code means less code. But also, optimized versions of opcode are provided if possible, such as in the example above.