Planetary collision with self gravity - isale-code/isale-wiki GitHub Wiki
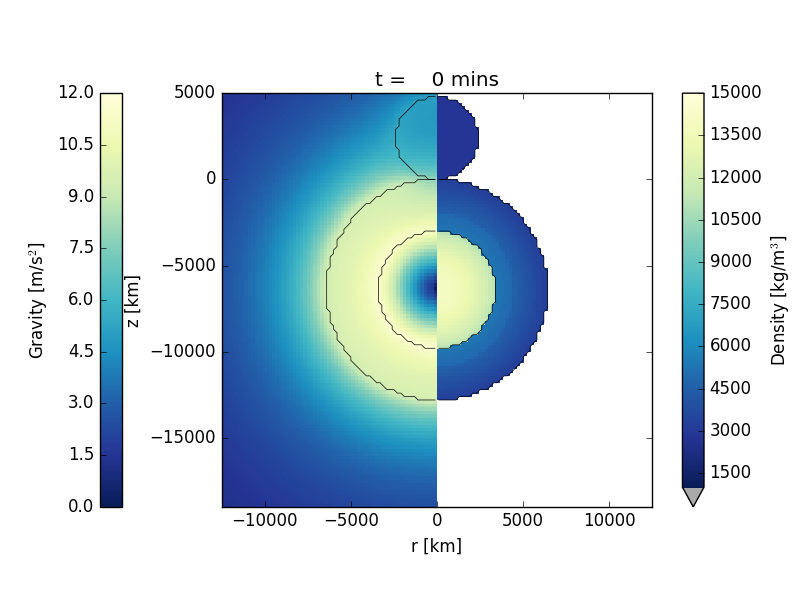
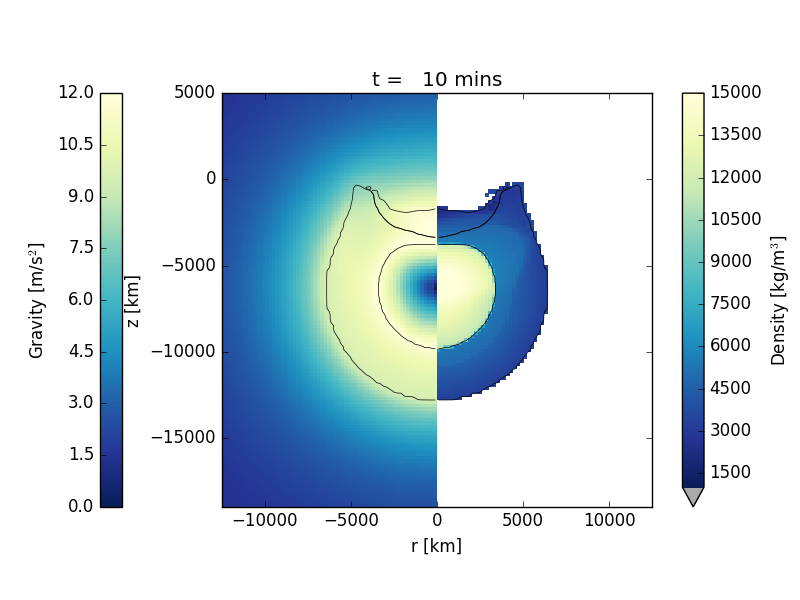
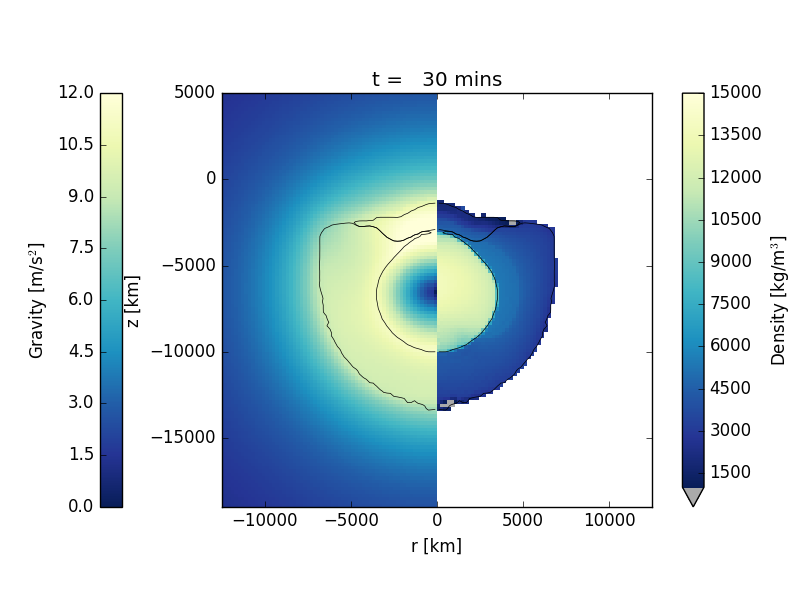
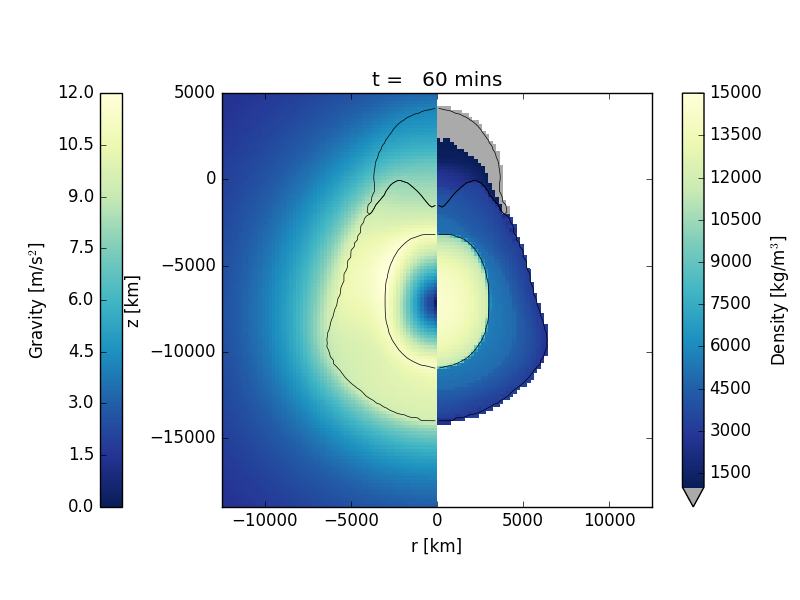
The model is a low-resolution model of an impact of a 4800 km diameter proto-planet striking the Earth head on at 12 km/s. The mantle of Earth is represented using a dunite material model; the impactor is represented by a basalt material model and Earth's core is represented by an iron material model. The gravity field for Earth is computed during start-up to be thermodynamically self-consistent with the pressure, density and temperature of Earth's interior. From this point on, the gravity field in the mesh is updated every 10 timesteps using iSALE's self-gravity algorithm. Each material's equation of state is defined using ANEOS-derived tables. The simulation terminates after 3 hours at which time Earth is still oscillating in response to the impact.
The example demonstrates how to set-up iSALE for 2D self-gravity problems involving a layered target planet.
Go to the relevant example directory
cd /share/examples/SelfGravity2D
Run iSALE2D. The simulation takes about half an hour, so this should be run in the background.
./iSALE2D &
The mesh is constructed using cylindrical geometry, with the left edge as the symmetry axis; no extension zones are used.
The set-up type is PLANET.
The geothermal gradient through the planet is defined with the parameters:
T_SURF                Surface temp. (K)             : 293.D0
DTDZSURF              Surface temp. gradient (K/m)  : 30.E-3
R_PLANET              Radius of planet (m)          : 6.37D6
D_LITH                Lithospheric thickness (m)    : 80.D3
D_LITH is the depth below the surface that the thermal gradient switches from being defined according to a conductive thermal gradient to a convective thermal gradient.
The self-gravity model options are set with the parameters:
GRAD_TYPE             gradient type                 : SELF   ! This sets the gravity models as self-gravity
GRAD_DIM              gradient dimension            : 3      ! This implies that gravity varies in all three dimensions in the mesh
SG_BARHUT             Self-grav efficiency param    : 0.1    ! A non-zero value of this parameter activates the optimized self-gravity calculation
SG_NCYC               Cycles between SG update      : 10     ! This parameter specifies that the gravity field is updated every 10 time steps (the default is 5)
The geometry of the simulated impactor and Earth are defined by the lines:
COL_SITE              Location of collision         : 100
------------------- Projectile ("Object") Parameters --------------------
OBJNUM                number of objects             : 3
OBJRESH               CPPR horizontal               :  12         :  32         :  17
OBJVEL                object velocity               : -1.2D4      : 0.D0        : 0.D0
OBJMAT                object material               : impactr     : mantle_     : core___
OBJTYPE               object type                   : SPHEROID    : SPHEROID    : SPHEROID
OBJTPROF              proj thermal prof             : CONST       : CONDCONVCAP : CONDCONVCAP
COL_SITE is required to locate the point (j-index of vertex) of collision in the mesh.
Three spherical objects are required to define the impactor and Earth. The first is the impactor, which has a velocity of 12 km/s vertically down and no thermal gradient (compulsory). The second object defines the outer layer of Earth (in this simulation this is the mantle as the crust cannot be resolved at this resolution). The third object defines the core. Both the mantle and core use the thermal profile @CONDCONVCAP@ which implies that a standard geothermal gradient is used, following a conductive gradient in the upper part and convective gradient in the lower part, with the additional stipulation that the temperature is capped at the solidus.
Apart from the left boundary, which is the symmetry axis, all boundary conditions are outflow.
------------------- Boundary Condition Parameters ----------------------
BND_L                 left                          : FREESLIP
BND_R                 right                         : OUTFLOW
BND_B                 bottom                        : OUTFLOW
BND_T                 top                           : OUTFLOW
All other model options are standard.
Standard ROCK strength model parameters, including solidus curves, are used for the basalt and dunite material models.
The iron core is modelled using the Johnson-Cook strength model.
The IVANOV damage model is used with standard parameters.
To produce images of the simulation to visualise the gravity field and density distribution using pySALEPlot:
python Plotting/DenGrv.py
The images, which should be identical to those shown below, will be output to the directory DenGrv/
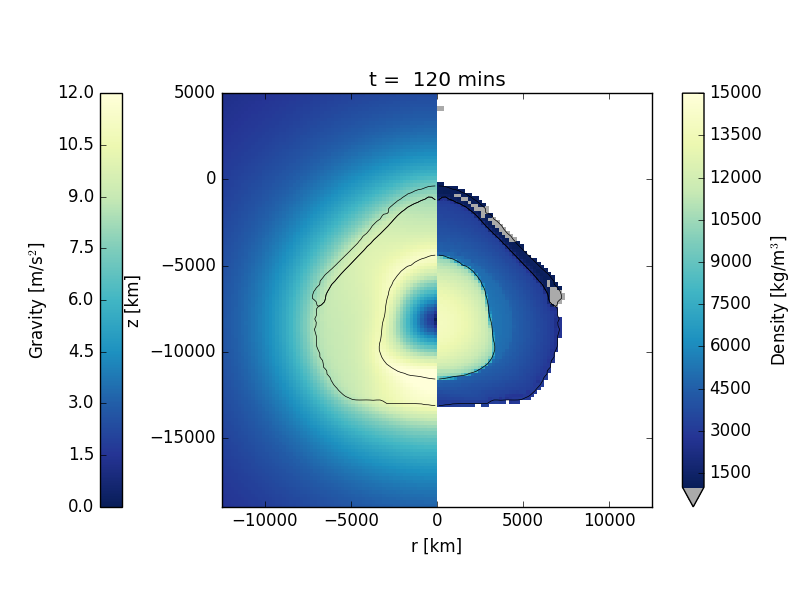
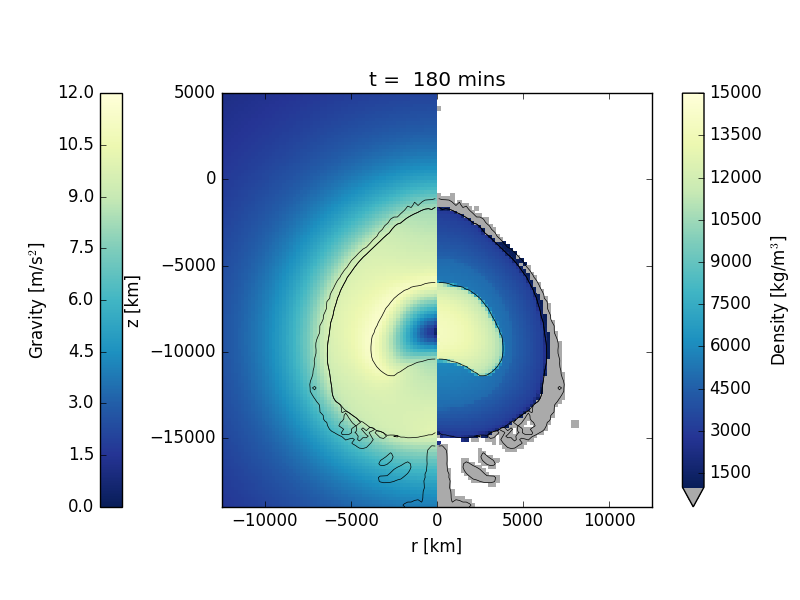
The figures below show a time series of the formation of the crater at the initial state, after 10 mins, after 30 mins, after 1 hour, after 2 hours, and after 3 hours. The left panel displays the gravity magnitude; the right side displays the density.
