Complex crater formation with dilatancy - isale-code/isale-wiki GitHub Wiki
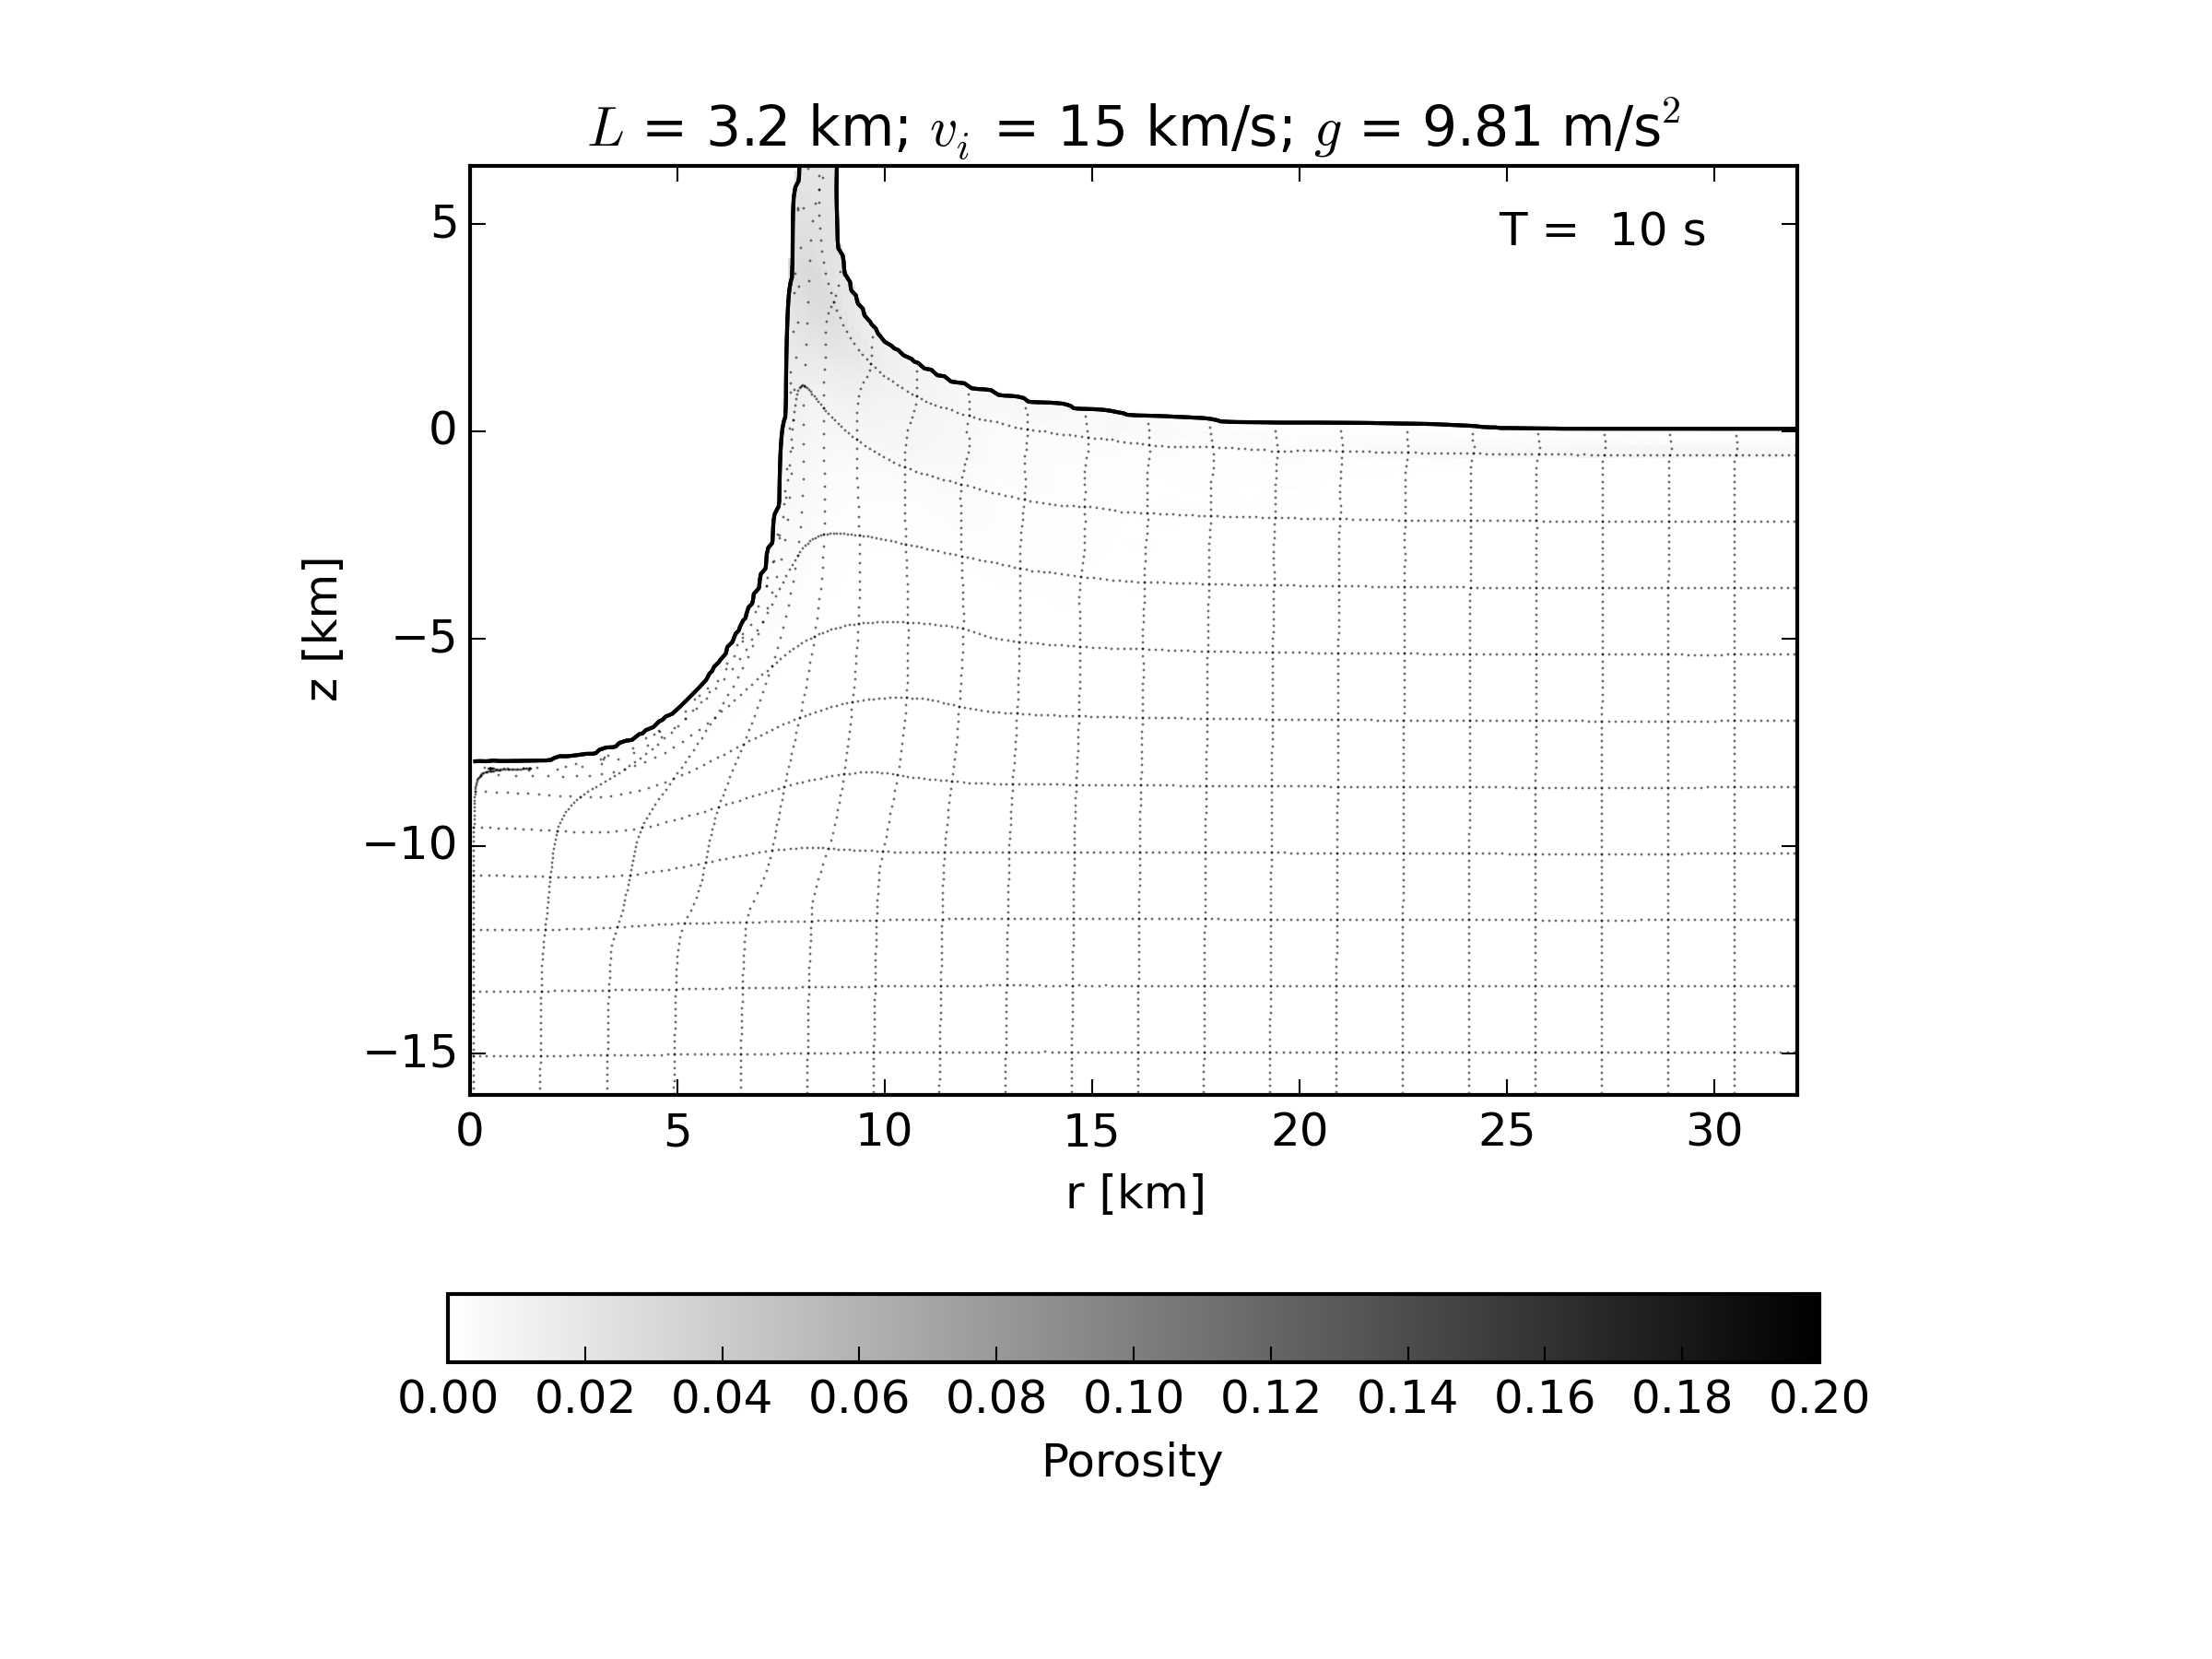
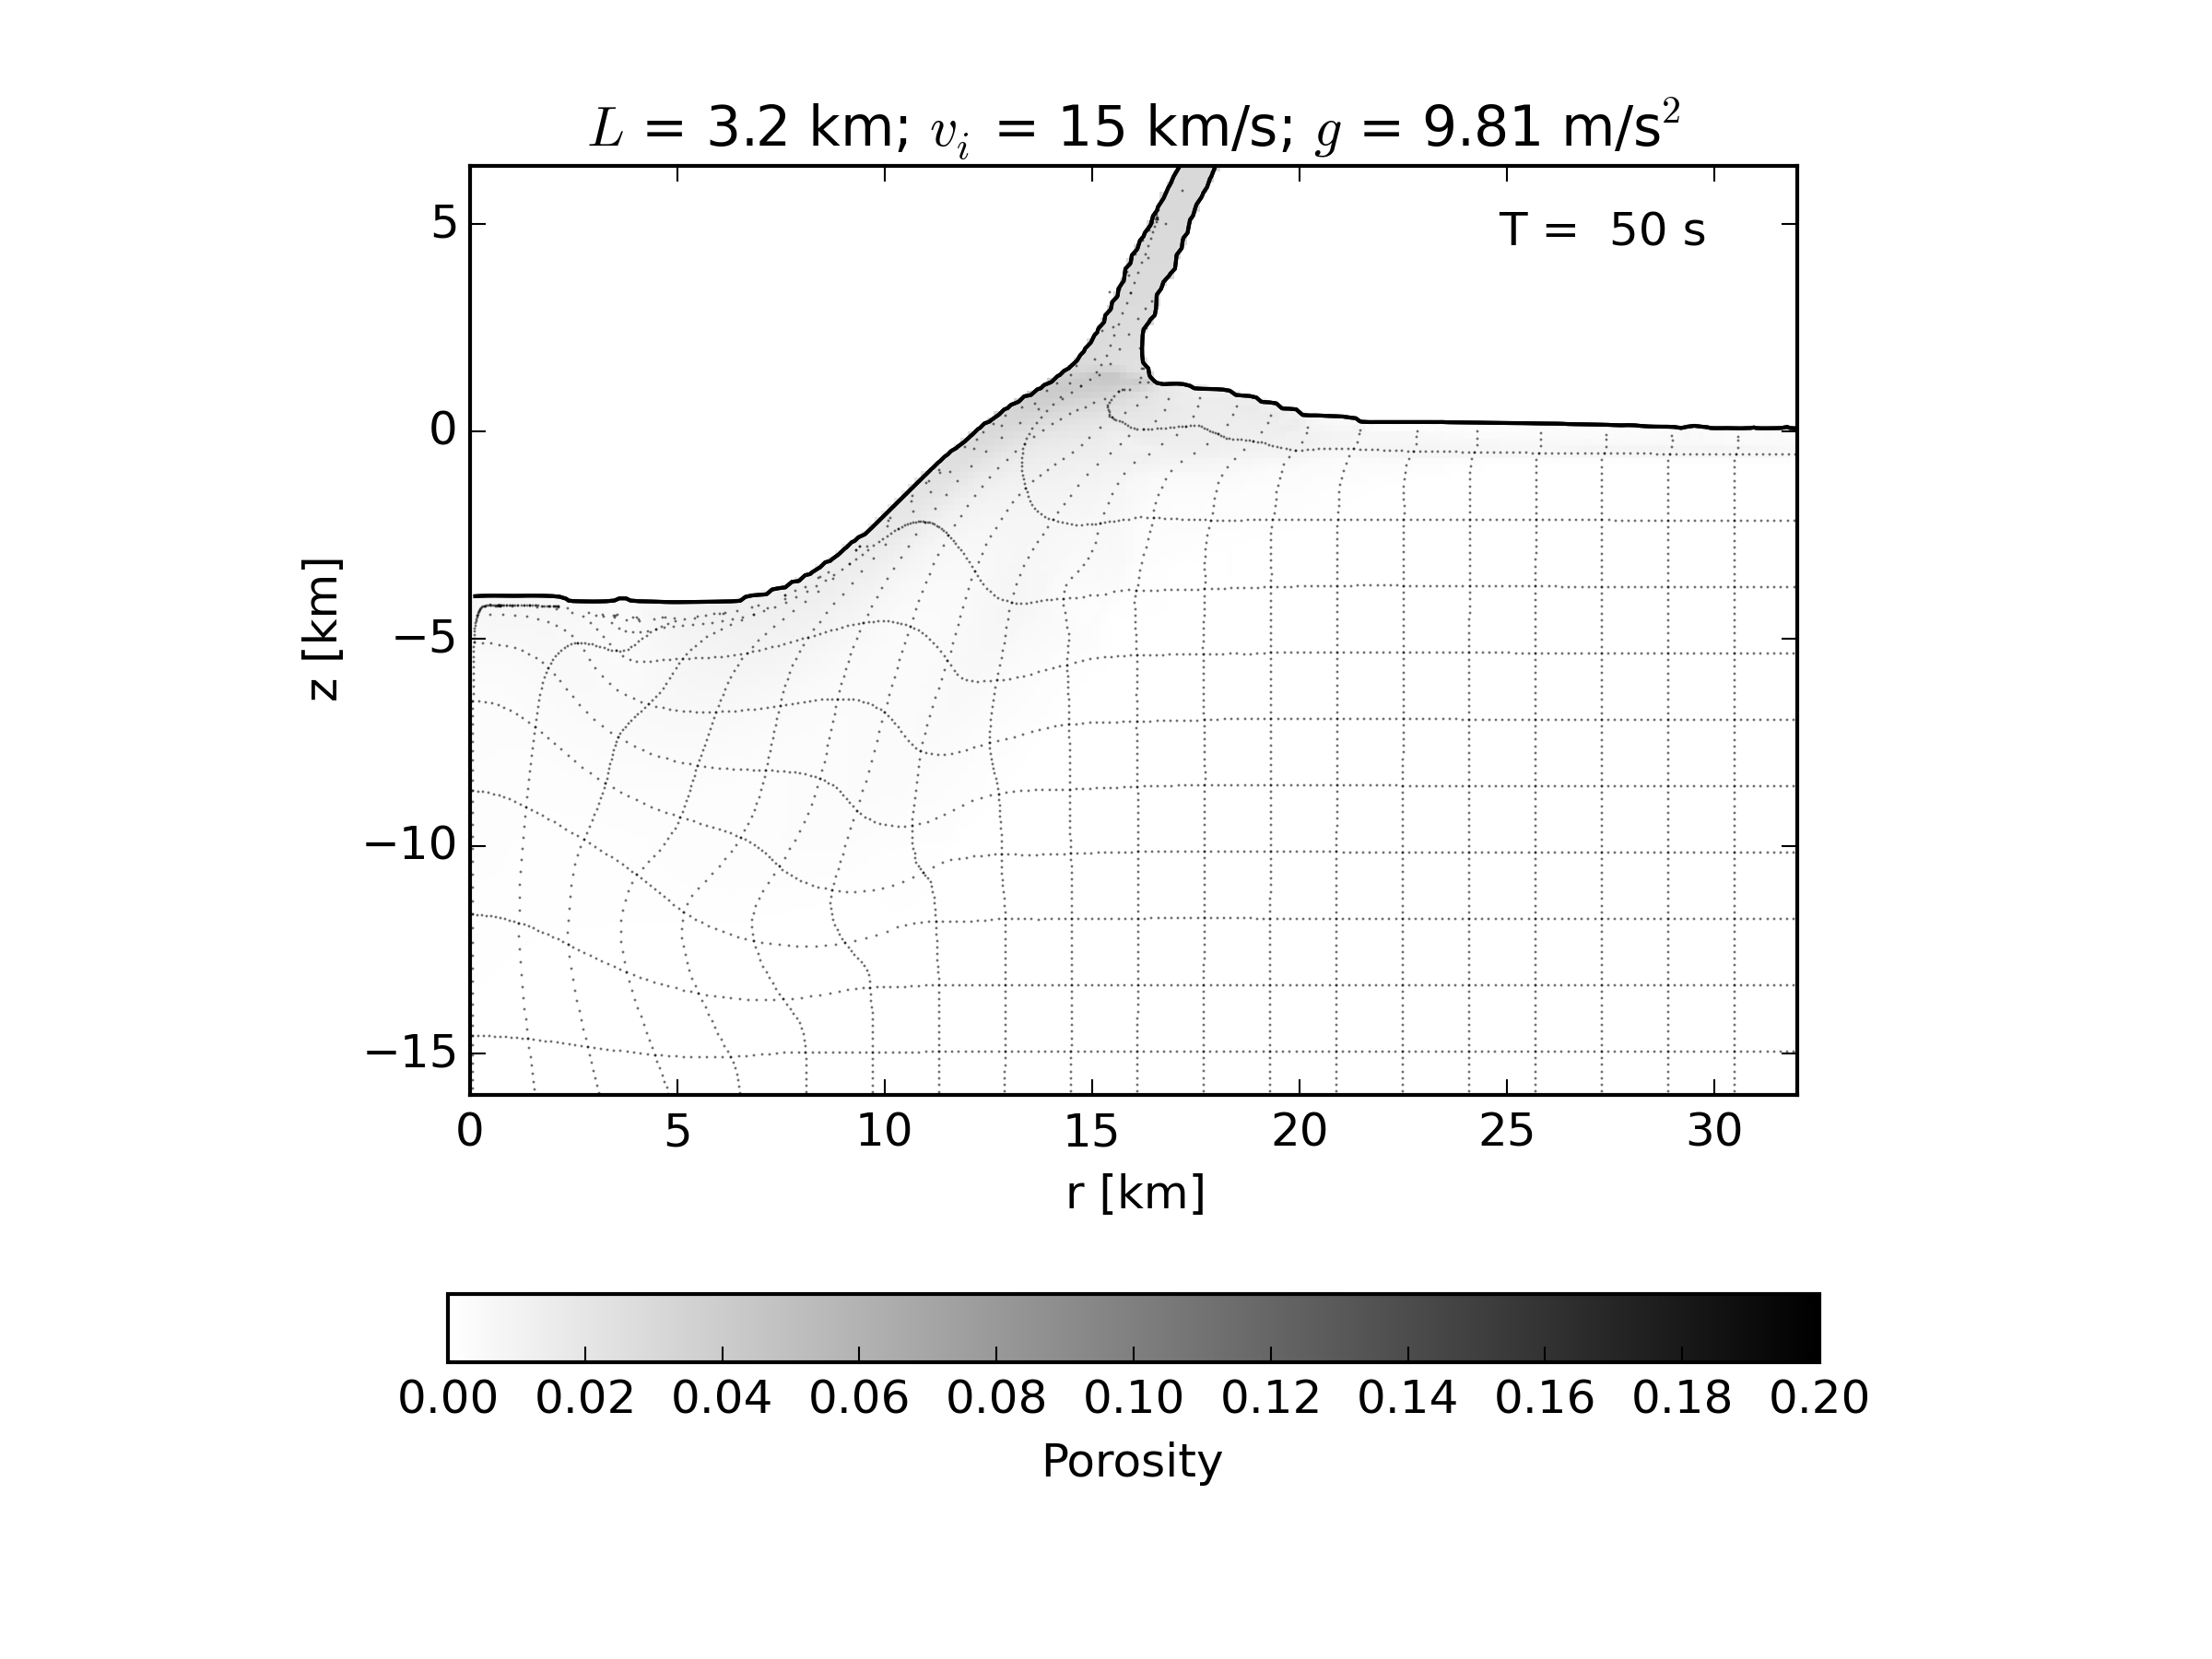
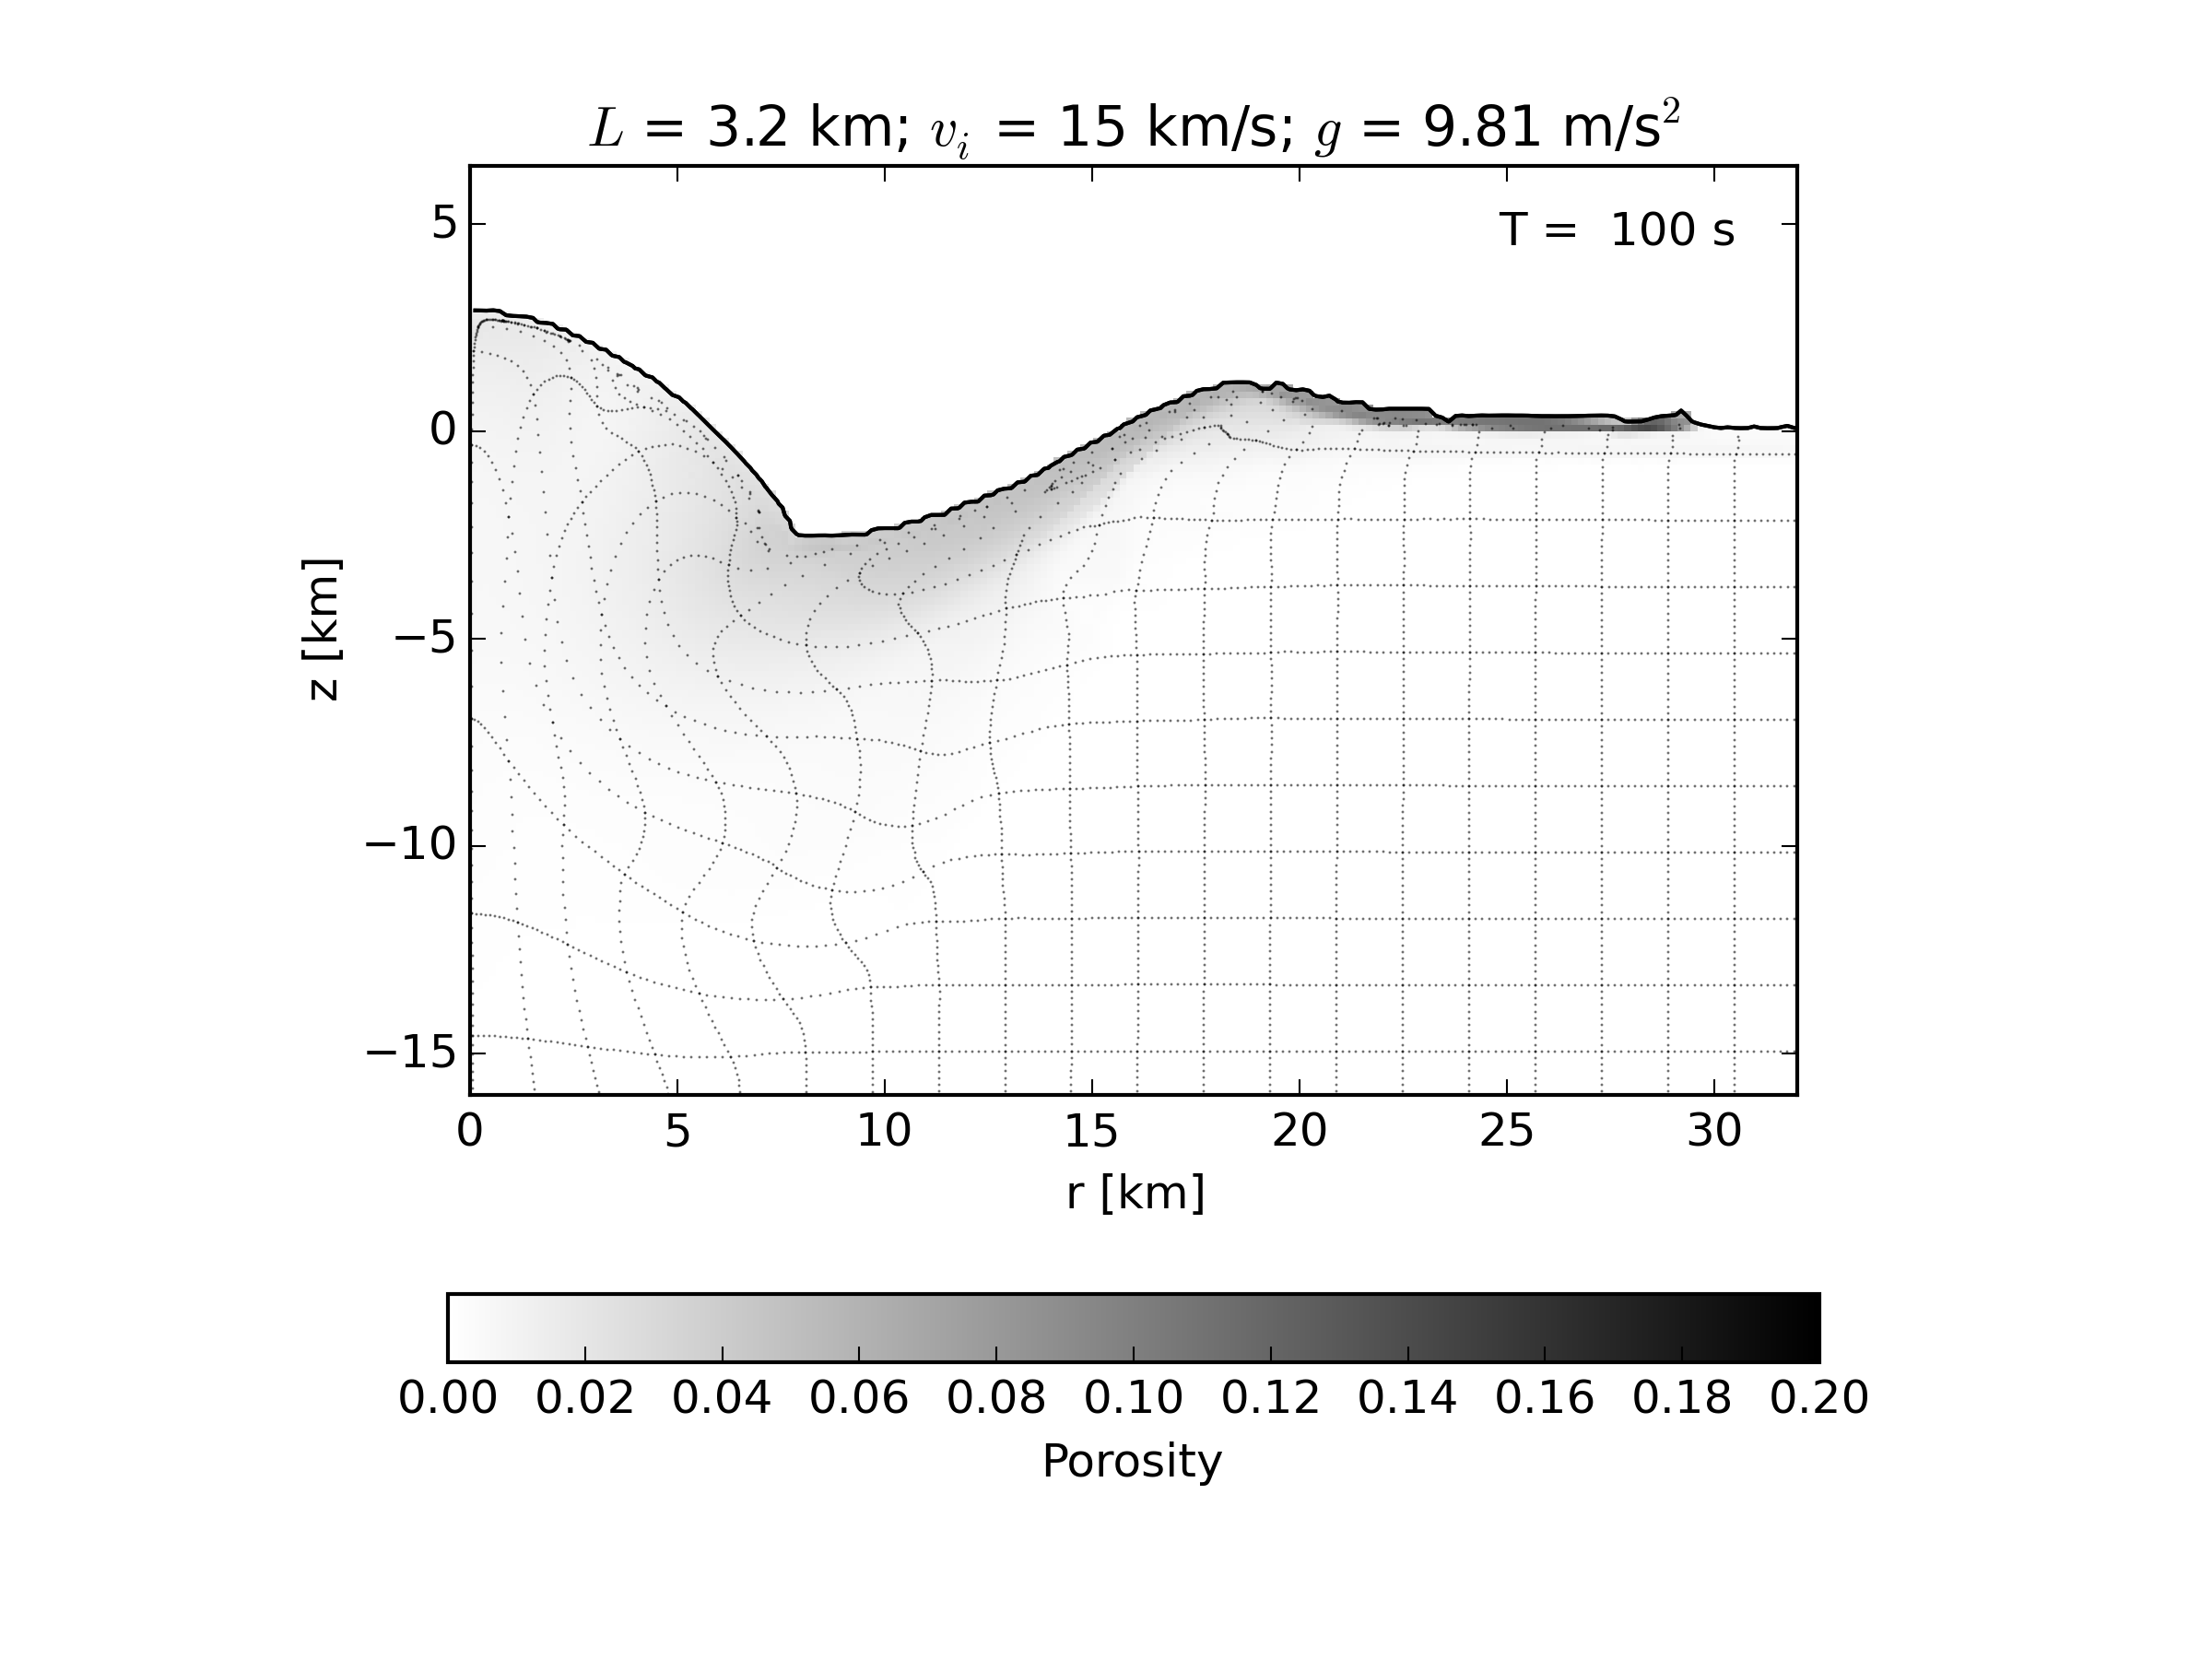
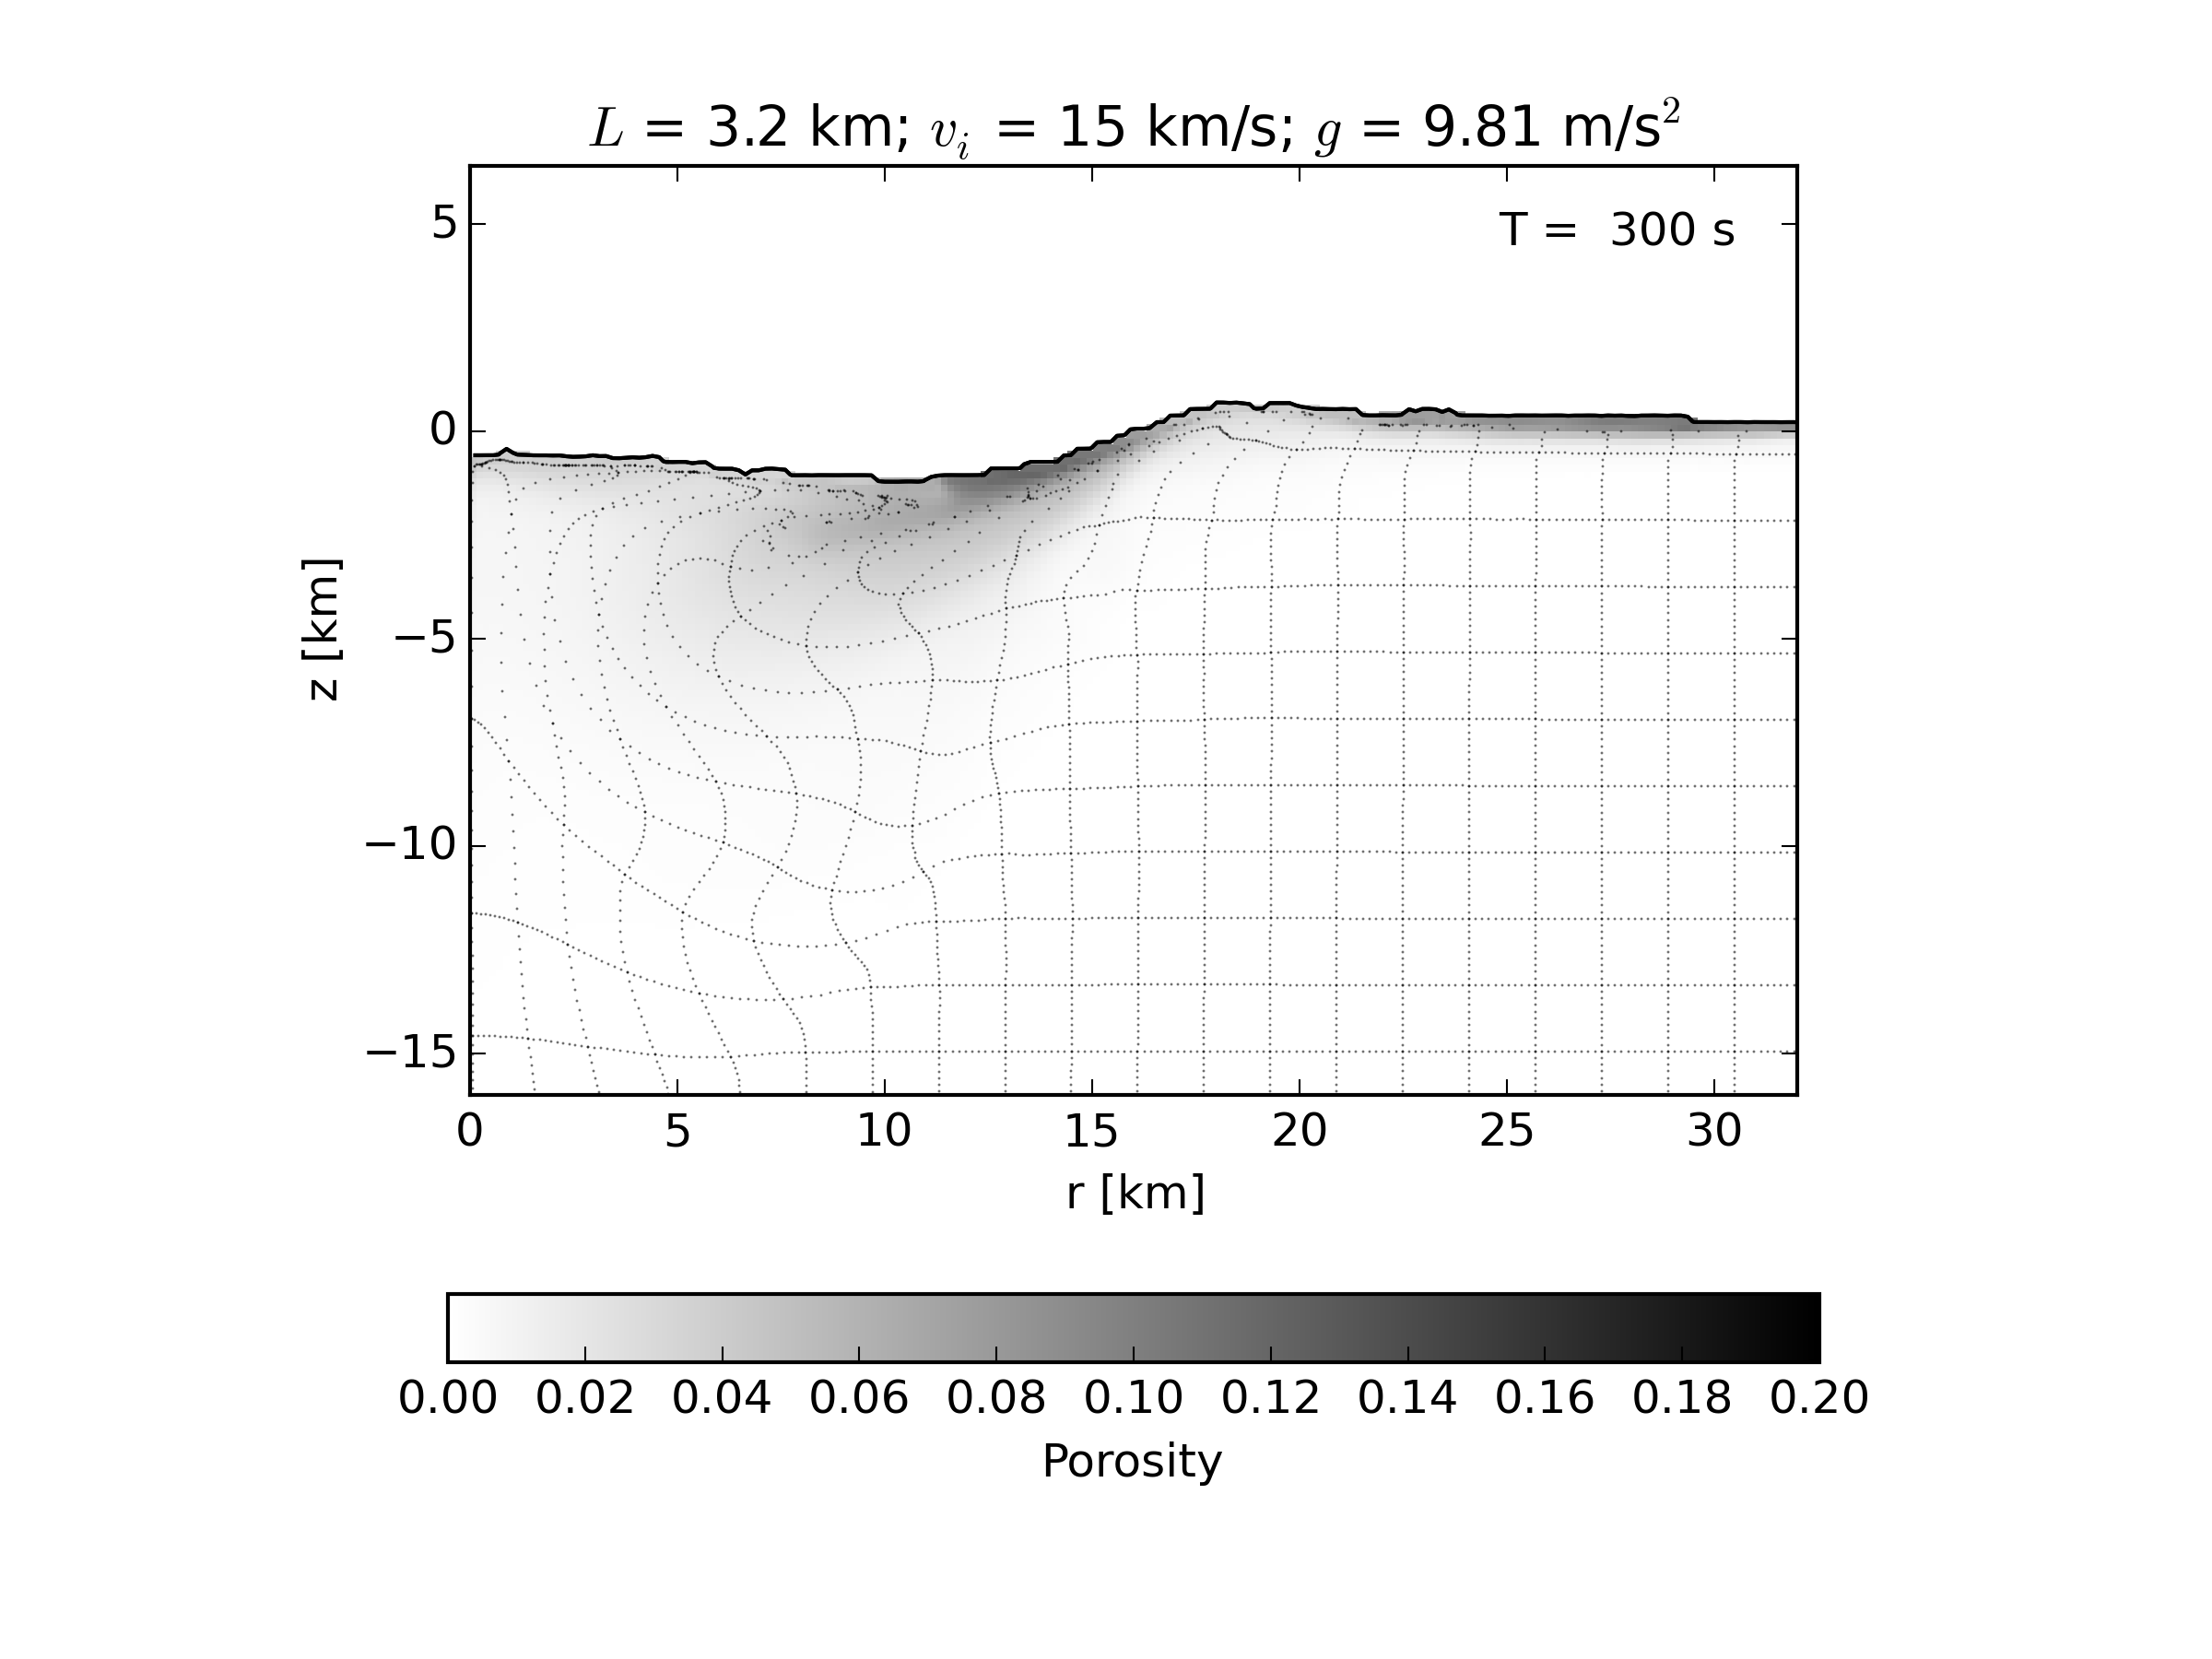
This is a low-resolution version of one of the simulations in Collins (2014). A 3.2-km diameter impactor strikes a flat target surface at 15 km/s. A granite-like material model is used for the impactor and target, with an ANEOS-derived equation of state table and a rock-like strength model. In addition, iSALE's dilatancy algorithm is employed to model the porosity generation that occurs by impact-induced shear deformation.
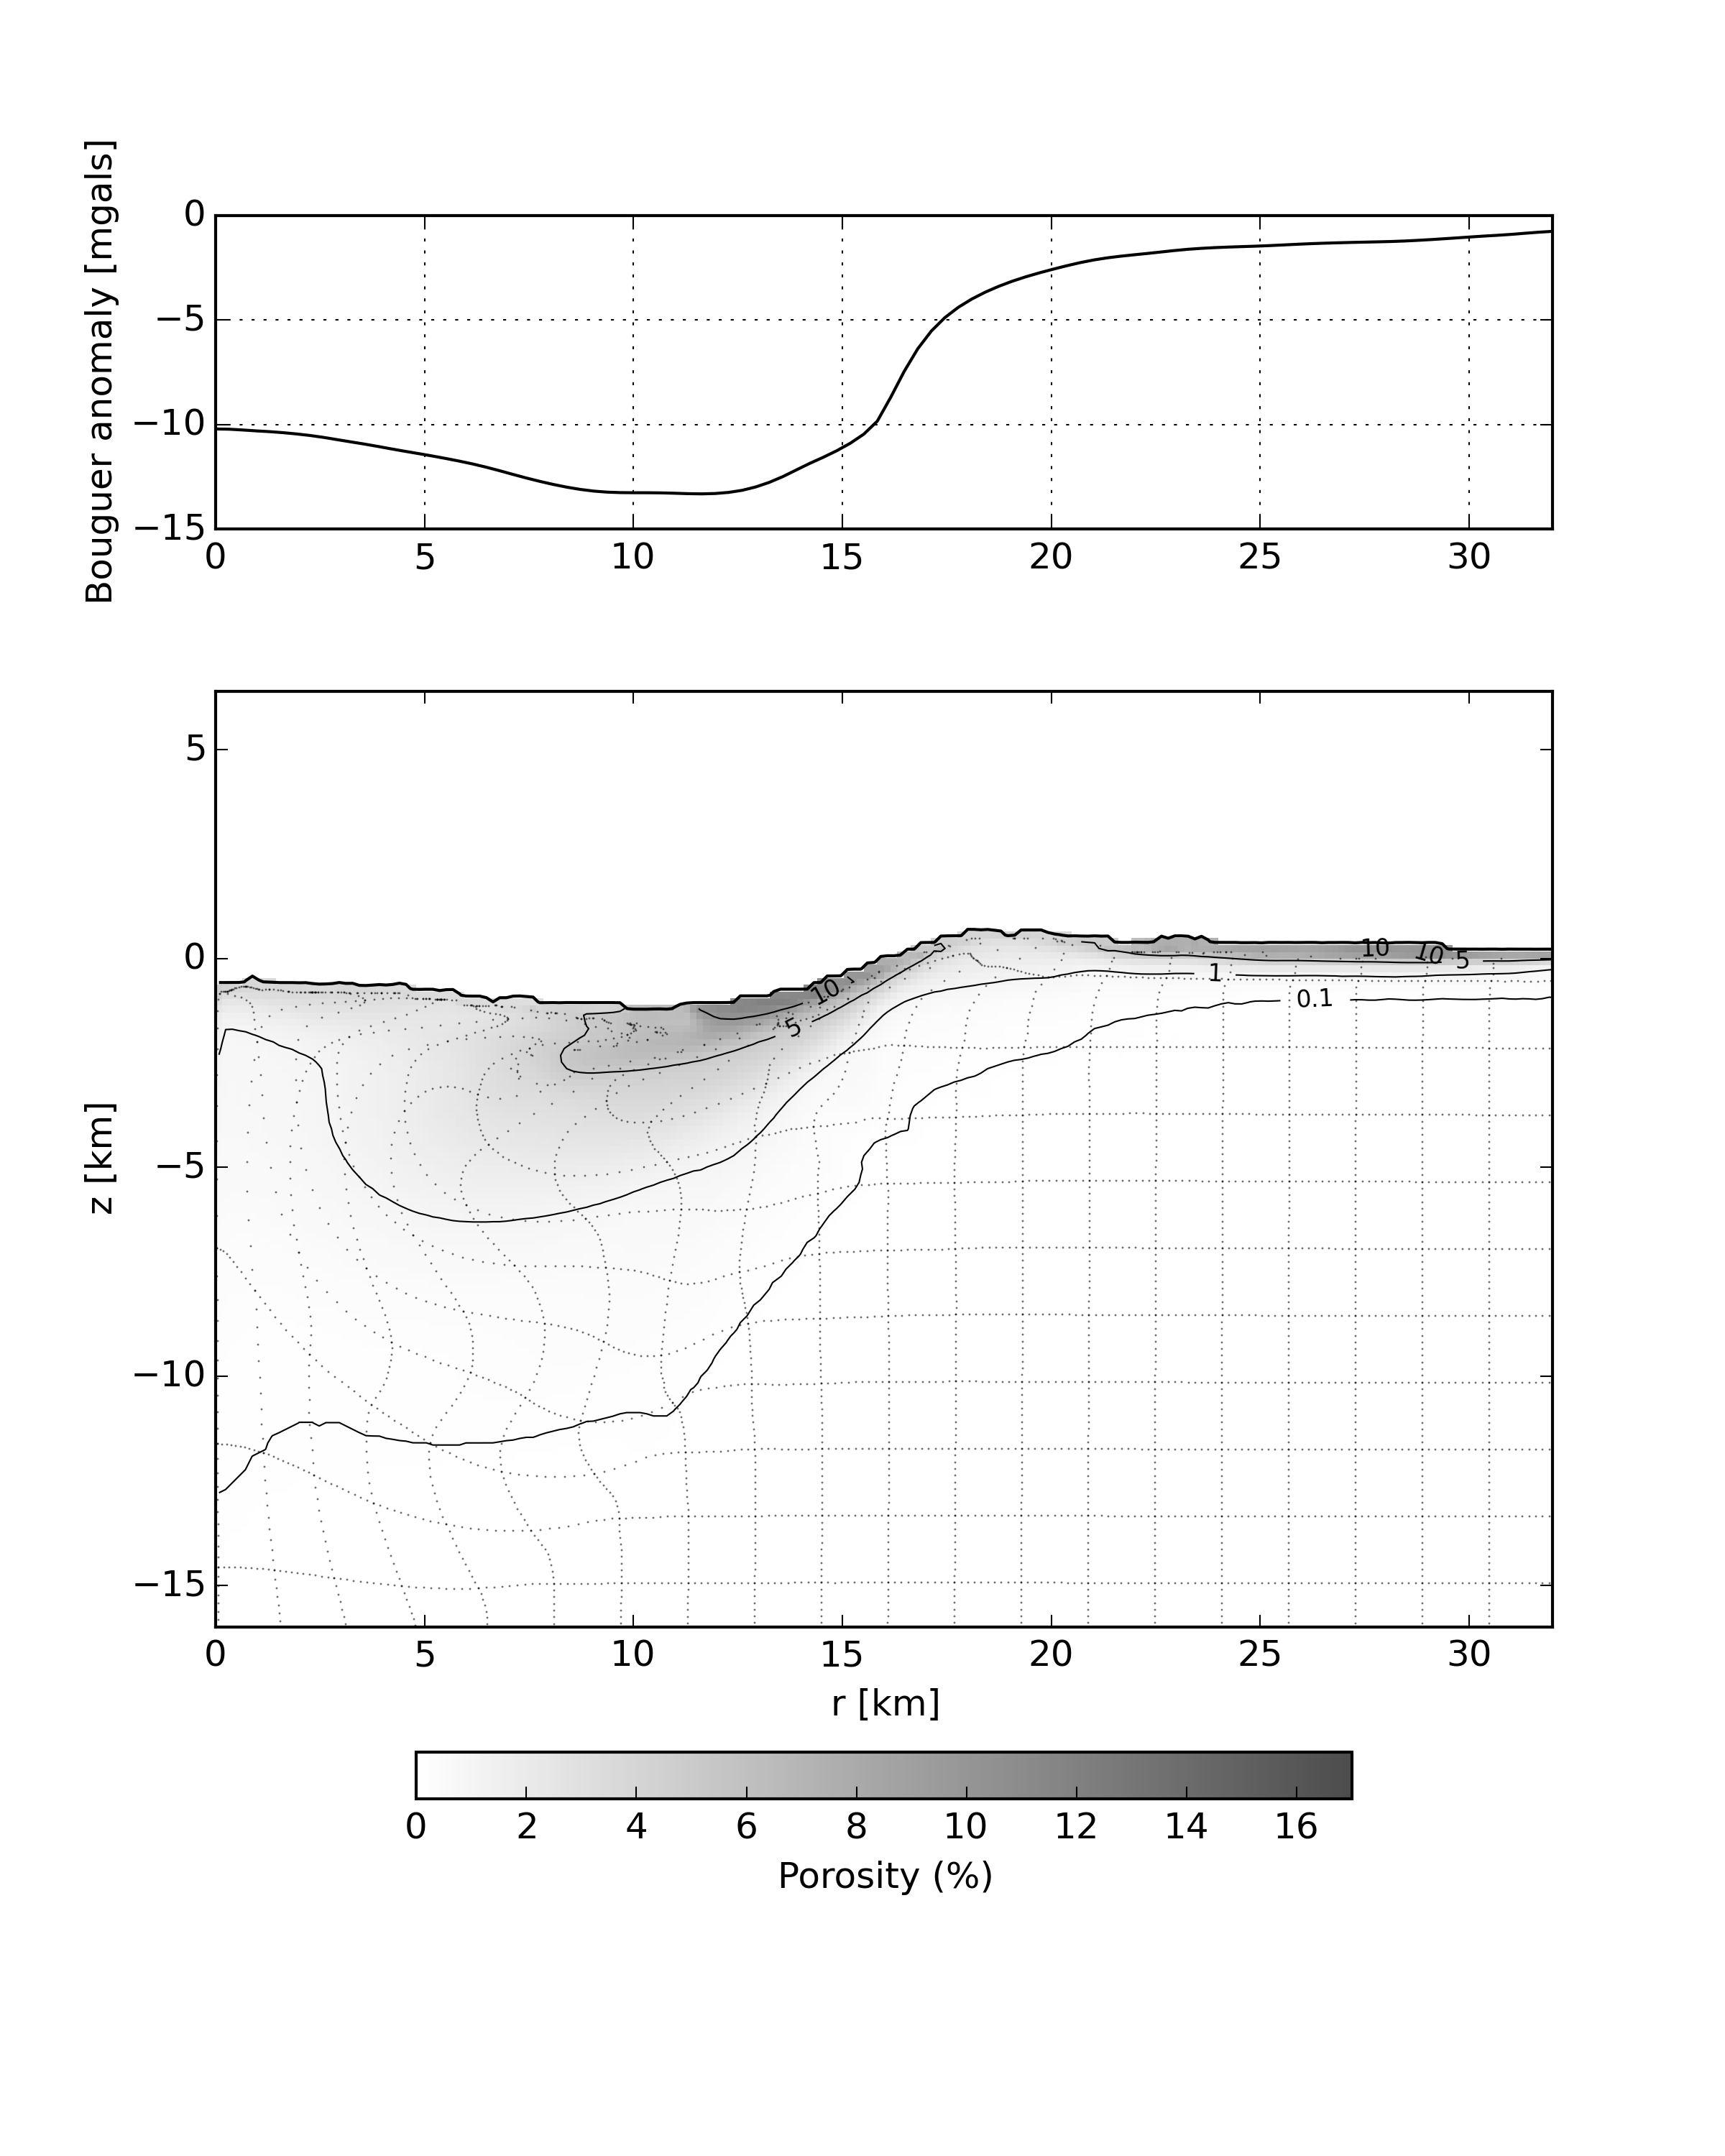
The example demonstrates the dilatancy model and how to compute gravity anomalies for simulated craters.
Go to the relevant example directory
cd /share/examples/dilatancy
Run iSALE2D. The simulation will take several hours, so this should be run in the background.
./iSALE2D &
To activate the dilatancy model we select the appropriate DILMOD option for each material. In this example we use the model variant where the dilatancy coefficient is a function of distension, pressure and temperature:
DILMOD Dilatancy model : ALPHAPT
The dilatancy model parameters are defined at the bottom of the material.inp file. ALPHACRIT and DILATPLIM define the distension and pressure, respectively, at which the dilatancy coefficient goes to zero. DILATCOEF is the maximum dilatancy coefficient (at zero pressure, temperature and porosity). DILATFRIC is the friction coefficient of the fully damaged material in the critically dilatant state (distension=ALPHACRIT).
ALPHACRIT   Critical distension           : 1.2D0
DILATCOEF   Max. dilatancy coef.          : 0.045D0
DILATPLIM   Zero dilat. coef. pressure    : 2.D8
DILATFRIC   Friction coef. at ALPHACRIT   : 0.4D0
To produce images of the simulation to visualise the porosity and material movement using pySALEPlot:
python Plotting/porosity_snapshots.py
The images, which should be identical to those shown below, will be output to the directory Plots/. The pySALEPlot plotting script can easily be modified to generate additional images and analysis.
An additional script can be run to calculate the gravity anomaly of the simulated crater:
python Plotting/porosity_gravity.py
Note that the gravity anomaly calculation is executed using the gravityAnomaly function in pySALEPlot, e.g.:
grav_anomaly = model.gravityAnomaly(anomalyTime=model.laststep,anomaly="BOUGUER",bouguer_den=2700.,altitude=0.)
This computes a Bouguer gravity anomaly using a correction density of 2700 kg/m3 at a datum altitude of zero (the pre-impact surface).
