SetChartPalette - innoventsolutions/birt-functions-lib GitHub Wiki
BIRT Charts use a palette for each series item. Control of the palette is done through the Chart UI components. The standard color palette is adequate but most report implementations would like to adopt a standard color palette. Modifying every example of your charts to use the same palette can be tedious.
This control allows you to use CSS to control the color and font of your series items. In the simplest use case, simply add a call to this method in your chart script
function beforeDrawSeries( series, isr, icsc )
{
	// Custom function maps to CSS entries
	// builds a palette based on CSS information
	CustomFunctions.SetChartPalette(series, icsc);
}
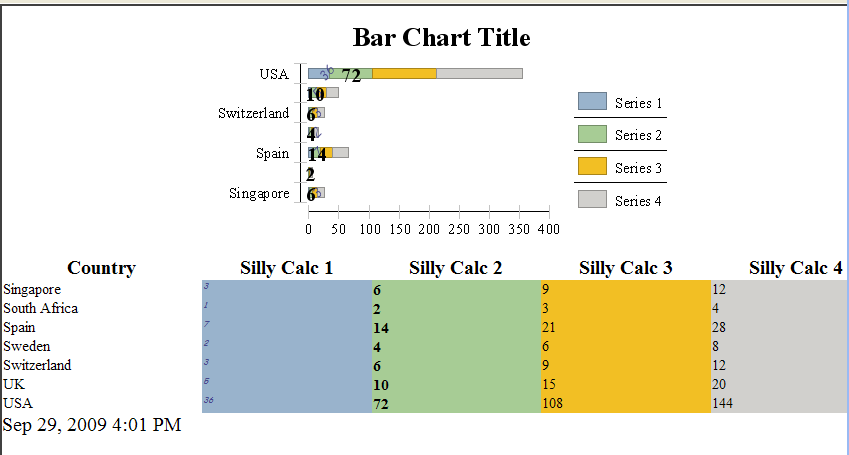
The function will look for entries in your CSS file named series-1, series-2... and apply the styles specified to each of the chart series. Given a CSS like this
.series-1 {
	background-color: rgb(153,179,204);
	background-image: url("blackboard.common/resources/image/series-1.gif");
	font-size: 8px;
	font-style: italic;
	font-style: oblique;
	font-family: cursive;
	color: rgb(70,70,140);
}
.series-2 {
	background-color: rgb(167,204,149);
	font-weight: bolder;
	background-image: url("blackboard.common/resources/image/series-2.gif");
}
.series-3 {
	background-color: rgb(242,191,36);
	background-image: url("blackboard.common/resources/image/series-3.gif");
}
.series-4 {
	background-color: rgb(209,208,205);
	background-image: url("blackboard.common/resources/image/series-4.gif");
}
Would give a report that looks like this. As you can see, I have used the same CSS styles in my table which follows the chart.
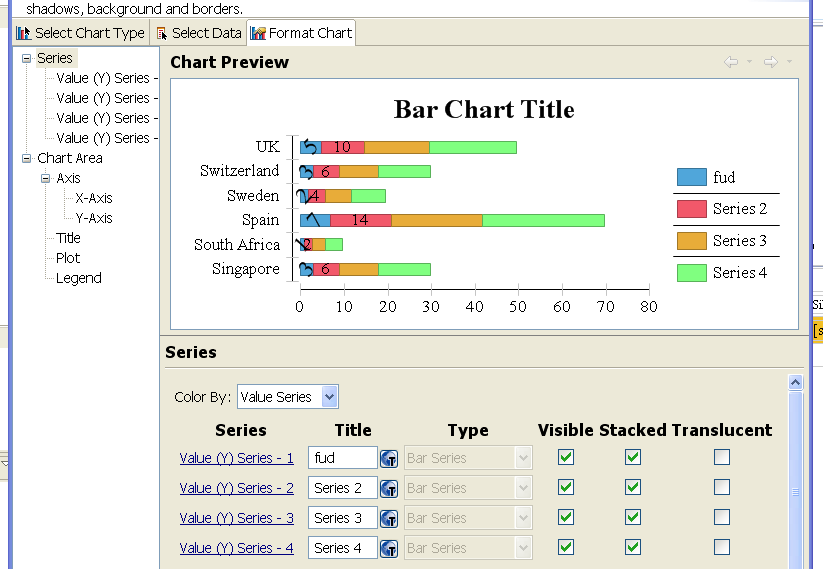
If your series names do not match series-1, series-2... Simply add CSS styles that match your series name. So if your series is named fud, then add the following entry to your CSS.
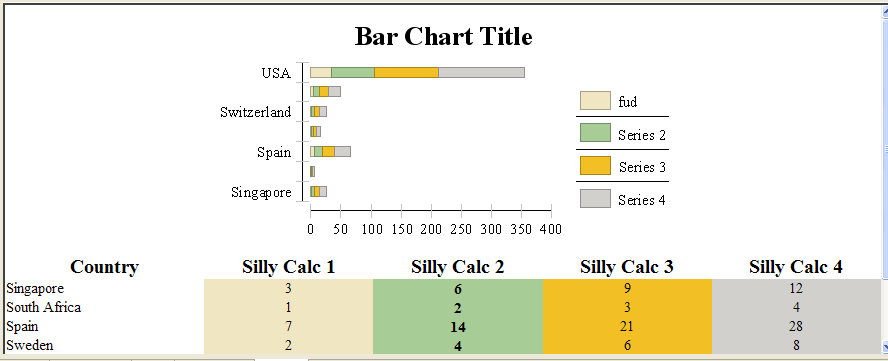
.fud {
	background-color: rgb(240,230,194);
	background-image: url("blackboard.common/resources/image/series-8.gif");
}
 Which will give the following output.
NOTE: The CSS properties will not show up in the chart at design time.