Probability Distributions - incanter/incanter GitHub Wiki
For an excellent chart of probability distribution relationships, see http://www.johndcook.com/distribution_chart.html
| Distribution | PDF Function | CDF Function | Sample Function | Quantile Function |
|---|---|---|---|---|
| Normal | pdf-normal | cdf-normal | sample-normal | quantile-normal |
| Gamma | pdf-gamma | cdf-gamma | sample-gamma | |
| Beta | pdf-beta | cdf-beta | sample-beta | |
| Chi Square | pdf-chisq | cdf-chisq | sample-chisq | |
| Student’s T | pdf-t | cdf-t | sample-t | quantile-t |
| Exponential | pdf-exp | cdf-exp | sample-exp | |
| Uniform | pdf-uniform | cdf-uniform | sample-uniform | |
| F | pdf-f | cdf-f |
| Distribution | PDF Function | CDF Function | Sample Function | Quantile Function |
|---|---|---|---|---|
| Binomial | pdf-binomial | cdf-binomial | sample-binomial | |
| Negative Binomial | pdf-neg-binomial | cdf-neg-binomial | sample-neg-binomial | |
| Poisson | pdf-poisson | cdf-poisson | sample-poisson |
| Distribution | PDF Function | CDF Function | Sample Function | Quantile Function |
|---|---|---|---|---|
| Multivariate Normal | sample-mvn | |||
| Wishart | sample-wishart |
Examples of plots from the Normal Distribution page at Wikipedia.
Plot PDFs of different normal distributions:
(def x (range -3 3 0.01))

(doto (xy-plot x (pdf-normal x)
                 :title "Normal PDF"
                 :y-label "Density"
                 :legend true)
      (add-lines x (pdf-normal x :sd (sqrt 0.2)))
      (add-lines x (pdf-normal x :sd (sqrt 5.0)))
      (add-lines x (pdf-normal x :mean -2 :sd (sqrt 0.5)))
      view)
Plot CDFs of different normal distributions
(doto (xy-plot x (cdf-normal x)
                 :title "Normal CDF"
                 :y-label "Probability"
                 :legend true)
      (add-lines x (cdf-normal x :sd (sqrt 0.2)))
      (add-lines x (cdf-normal x :sd (sqrt 5.0)))
      (add-lines x (cdf-normal x :mean -2 :sd (sqrt 0.5)))
      view)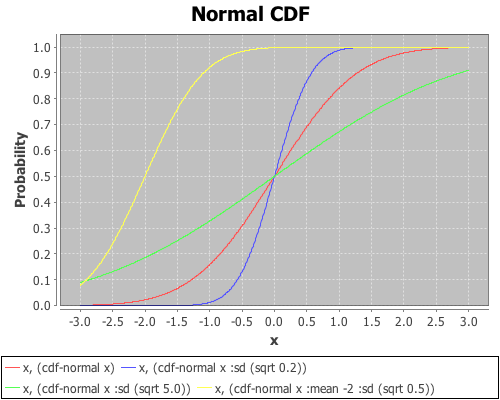
Make box-plots for each of the normal distributions
(doto (box-plot (sample-normal 1000)
                :title "Normal Boxplot"
                :legend true)
      (add-box-plot (sample-normal 1000 :sd (sqrt 0.2)))
      (add-box-plot (sample-normal 1000 :sd (sqrt 5.0)))
      (add-box-plot (sample-normal 1000 :mean -2 :sd (sqrt 0.5)))
      view)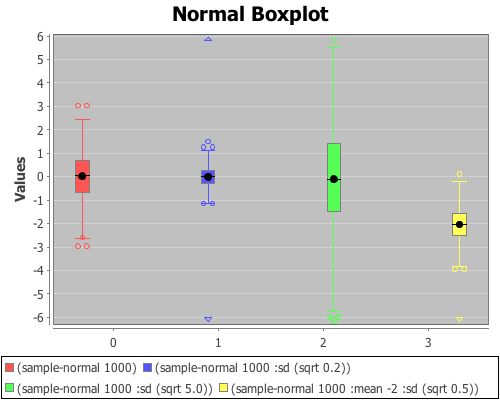
Make a histogram of a sample of 1000 standard normal deviates
(view (histogram (sample-normal 1000)
        :title "Normal Histogram (mean, sd)"
        :legend true))
Plot the inverse of the normal distribution
(def p (range 0.01 1 0.01))
(doto (xy-plot p (quantile-normal p)
                 :title "Normal Inverse"
                 :x-label "Probability"
                 :y-label "X"
                 :legend true)
      (add-lines p (quantile-normal p :sd (sqrt 0.2)))
      (add-lines p (quantile-normal p :sd (sqrt 5.0)))
      (add-lines p (quantile-normal p :mean -2 :sd (sqrt 0.5)))
      view)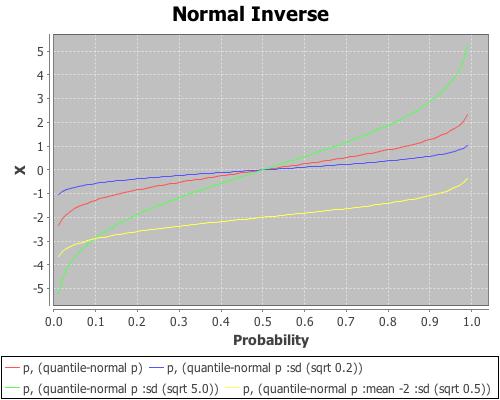
Examples of plots from the Gamma Distribution page at Wikipedia.
Plot the PDFs of different gamma distributions:
(def x (range 0 20 0.1))
(doto (xy-plot x (pdf-gamma x :shape 1 :rate 2)
                 :legend true
                 :title "Gamma PDF"
                 :y-label "Density")
      (add-lines x (pdf-gamma x :shape 2 :rate 2))
      (add-lines x (pdf-gamma x :shape 3 :rate 2))
      (add-lines x (pdf-gamma x :shape 5 :rate 1))
      (add-lines x (pdf-gamma x :shape 9 :rate 0.5))
      view)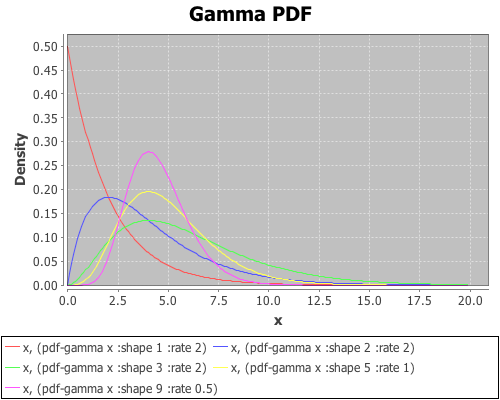
Plot CDFs of different gamma distributions.
(doto (xy-plot x (cdf-gamma x :shape 1 :rate 2)
                 :title "Gamma CDF"
                 :legend true
                 :y-label "Probability")
      (add-lines x (cdf-gamma x :shape 2 :rate 2))
      (add-lines x (cdf-gamma x :shape 3 :rate 2))
      (add-lines x (cdf-gamma x :shape 5 :rate 1))
      (add-lines x (cdf-gamma x :shape 9 :rate 0.5))
      view)
Make box-plots for each of the gamma distributions
(doto (box-plot (sample-gamma 1000 :shape 1 :rate 2)
                :title "Gamma Boxplot"
                :legend true)
      (add-box-plot (sample-gamma 1000 :shape 2 :rate 2))
      (add-box-plot (sample-gamma 1000 :shape 3 :rate 2))
      (add-box-plot (sample-gamma 1000 :shape 5 :rate 1))
      (add-box-plot (sample-gamma 1000 :shape 9 :rate 0.5))
      view)
Make a histogram of a sample of 1000 Gamma deviates
(view (histogram (sample-gamma 1000 :shape 1 :rate 2)
        :title "Gamma Histogram"))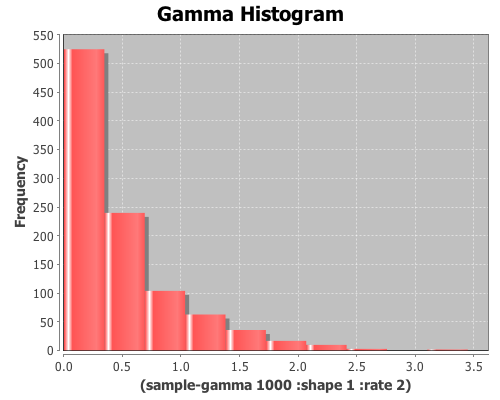
Examples of plots from the Beta Distribution page at Wikipedia.
Plot PDFs of different beta distributions.
(def x (range 0 1 0.01))
(doto (xy-plot x (pdf-beta x :alpha 1 :beta 1)
                 :title "Beta PDF"
                 :y-label "Density"
                 :legend true)
      (add-lines x (pdf-beta x :alpha 5 :beta 1))
      (add-lines x (pdf-beta x :alpha 1 :beta 3))
      (add-lines x (pdf-beta x :alpha 2 :beta 2))
      (add-lines x (pdf-beta x :alpha 2 :beta 5))
      view)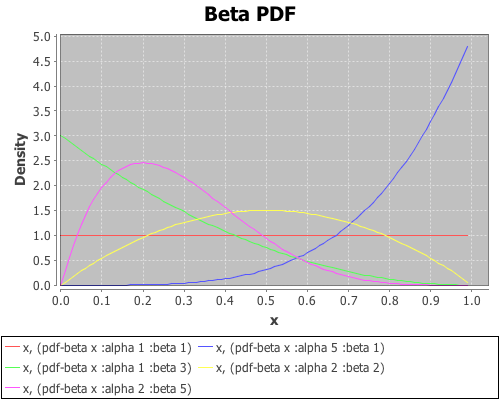
Plot CDFs of different beta distributions.
(doto (xy-plot x (cdf-beta x :alpha 1 :beta 1)
                 :title "Beta CDF"
                 :y-label "Probability"
                 :legend true)
      (add-lines x (cdf-beta x :alpha 5 :beta 1))
      (add-lines x (cdf-beta x :alpha 1 :beta 3))
      (add-lines x (cdf-beta x :alpha 2 :beta 2))
      (add-lines x (cdf-beta x :alpha 2 :beta 5))
      view)
Make box-plots for each of the Beta distributions.
(doto (box-plot (sample-beta 1000 :alpha 1 :beta 1)
                :title "Beta Boxplot"
                :legend true)
      (add-box-plot (sample-beta 1000 :alpha 5 :beta 1))
      (add-box-plot (sample-beta 1000 :alpha 1 :beta 3))
      (add-box-plot (sample-beta 1000 :alpha 2 :beta 2))
      (add-box-plot (sample-beta 1000 :alpha 2 :beta 5))
      view)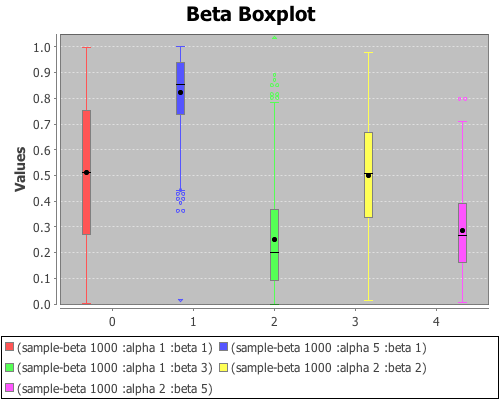
Make a histogram of a sample of 1000 beta deviates.
(view (histogram (sample-beta 1000 :alpha 5 :beta 1)
        :title "Beta Histogram (alpha,beta)"))
Examples of plots from the Chi Square Distribution page at Wikipedia
Plot the PDFs of different chi square distributions.
(def x (range 0.1 8 0.01))
(doto (xy-plot x (pdf-chisq x :df 1)
                 :title "Chi Square PDF"
                 :x-label "X"
                 :y-label "Density"
                 :legend true)
      (add-lines x (pdf-chisq x :df 2))
      (add-lines x (pdf-chisq x :df 3))
      (add-lines x (pdf-chisq x :df 4))
      (add-lines x (pdf-chisq x :df 5))
      view)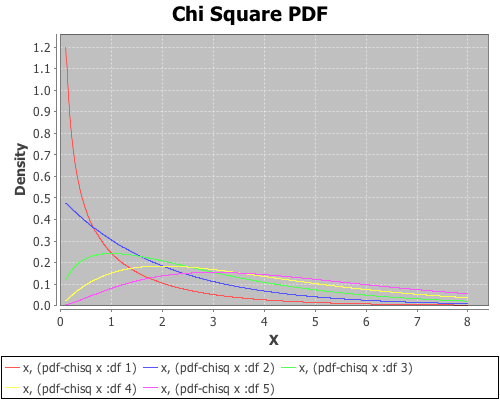
Plot CDFs for different chi square distributions.
(doto (xy-plot x (cdf-chisq x :df 1)
                 :title "Chi Square CDF"
                 :x-label "X"
                 :y-label "Probability"
                 :legend true)
      (add-lines x (cdf-chisq x :df 2))
      (add-lines x (cdf-chisq x :df 3))
      (add-lines x (cdf-chisq x :df 4))
      (add-lines x (cdf-chisq x :df 5))
      view)
Make box-plots for each of the chi square distributions.
(doto (box-plot (sample-chisq 1000 :df 1)
                :title "Chi Square Boxplot"
                :legend true)
      (add-box-plot (sample-chisq 1000 :df 2))
      (add-box-plot (sample-chisq 1000 :df 3))
      (add-box-plot (sample-chisq 1000 :df 4))
      (add-box-plot (sample-chisq 1000 :df 5))
      view)
Make a histogram of a sample of 1000 chi square deviates.
(view (histogram (sample-chisq 1000 :df 1)
        :title "Chi Square Histogram"))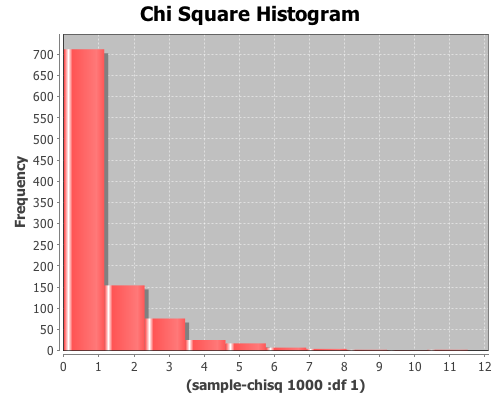
Examples of plots from the Student’s T-Distribution page at Wikipedia.
Plot PDFs of different Student’s T distribution.
(def x (range -5 5 0.01))
(doto (xy-plot x (pdf-t x :df 1)
                 :title "Student's T PDF"
                 :legend true
                 :x-label "X"
                 :y-label "Density")
      (add-lines x (pdf-t x :df 2))
      (add-lines x (pdf-t x :df 5))
      (add-lines x (pdf-t x :df 10))
      (add-lines x (pdf-t x :df 1000))
      view)
Plot CDFs of different Student’s T distribution.
(doto (xy-plot x (cdf-t x :df 1)
                 :title "Student's T CDF"
                 :legend true
                 :x-label "X"
                 :y-label "Probability")
      (add-lines x (cdf-t x :df 2))
      (add-lines x (cdf-t x :df 5))
      (add-lines x (cdf-t x :df 10))
      (add-lines x (cdf-t x :df 1000))
      view)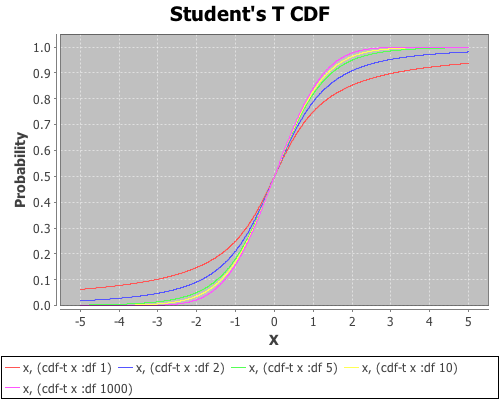
Make box-plots for each of the Student’s t distributions.
(doto (box-plot (sample-t 1000 :df 1)
                :title "Student's t Boxplot"
                :legend true)
      (add-box-plot (sample-t 1000 :df 2))
      (add-box-plot (sample-t 1000 :df 5))
      (add-box-plot (sample-t 1000 :df 10))
      (add-box-plot (sample-t 1000 :df 1000))
      view)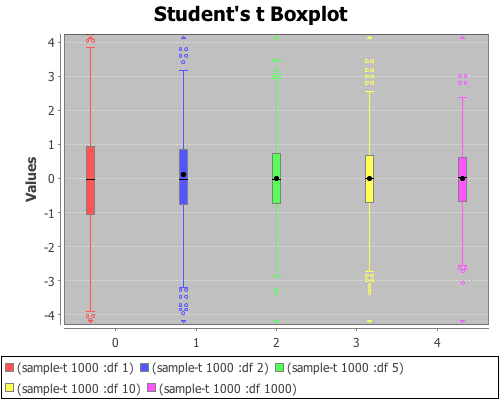
Make a histogram of a sample of 1000 Chi Square deviates.
(view (histogram (sample-t 1000 :df 10) :title "Student's t Histogram"))
Plot the quantiles of the Student’s t distribution.
(def p (range 0.05 1 0.01))
(doto (xy-plot p (quantile-t p :df 1)
                 :title "Student's t Quantiles (df)"
                 :x-label "Probability"
                 :y-label "X"
                 :legend true)
      (add-lines p (quantile-t p :df 2))
      (add-lines p (quantile-t p :df 5))
      (add-lines p (quantile-t p :df 10))
      (add-lines p (quantile-t p :df 50))
      view)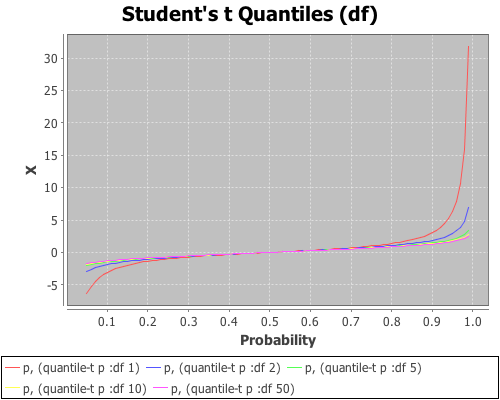
Examples of plots from the Exponential Distribution page at Wikipedia.
Plot PDFs for different exponential distributions.
(def x (range 0 5 0.01))
(doto (xy-plot x (pdf-exp x :rate 1/2)
                 :title "Exponential PDF"
                 :x-label "X"
                 :y-label "Density"
                 :legend true)
      (add-lines x (pdf-exp x :rate 1))
      (add-lines x (pdf-exp x :rate 1.5))
      view)
Plot CDFs for different exponential distributions.
(doto (xy-plot x (cdf-exp x :rate 1/2)
                 :title "Exponential CDF"
                 :x-label "X"
                 :y-label "Probability"
                 :legend true)
      (add-lines x (cdf-exp x :rate 1))
      (add-lines x (cdf-exp x :rate 1.5))
      view)
Make box-plots for each of the Exponentials distributions.
(doto (box-plot (sample-exp 1000 :rate 1/2)
                :title "Exponential Boxplot"
                :legend true)
      (add-box-plot exp-box-plot (sample-exp 1000 :rate 1))
      (add-box-plot exp-box-plot (sample-exp 1000 :rate 1.5))
      view)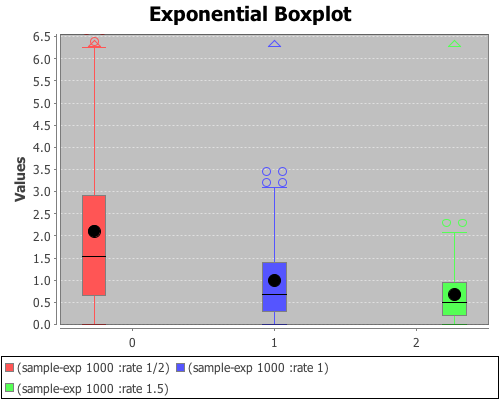
Make a histogram of a sample of 1000 Exponential deviates.
(view (histogram (sample-exp 1000 :rate 1.5)
        :title "Exponential Histogram (rate)"
        :nbins 20))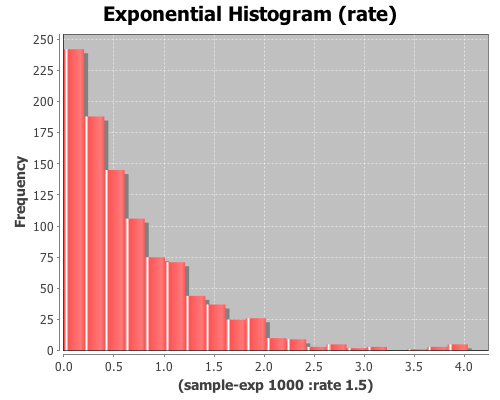
Examples of plots from the Continuous Uniform Distribution page at Wikipedia.
Plot of the uniform PDF
(def x (range 1 10.01 0.01))
(doto (xy-plot x (pdf-uniform x :min 1 :max 10)
                 :title "Uniform PDF"
                 :y-label "Density")
      view)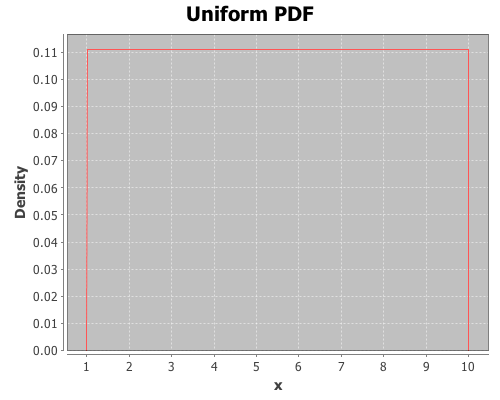
Plot of the uniform CDF
(doto (xy-plot x (cdf-uniform x :min 1 :max 10)
                 :title "Uniform CDF"
                 :y-label "Probability")
      view)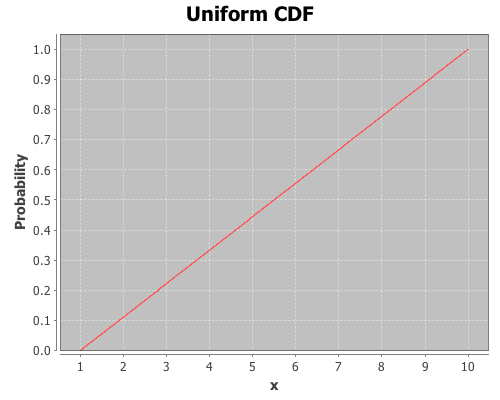
Make a histogram of a sample of 1000 standard normal deviates.
(view (histogram (sample-uniform 1000) :title "Uniform Histogram"))
(view (histogram (sample-uniform 1000 :min 0 :max 100 :integers true)
                 :title "Uniform Histogram"))
Examples of plots from the F Distribution page at Wikipedia.
Plots of PDFs of different F distributions.
(def x (range 0 5 0.01))
(doto (xy-plot x (pdf-f x :df1 2 :df2 1)
                 :title "F PDF"
                 :y-label "Density"
                 :legend true)
      (add-lines x (pdf-f x :df1 5 :df2 2))
      (add-lines x (pdf-f x :df1 100 :df2 1))
      (add-lines x (pdf-f x :df1 100 :df2 100))
      view)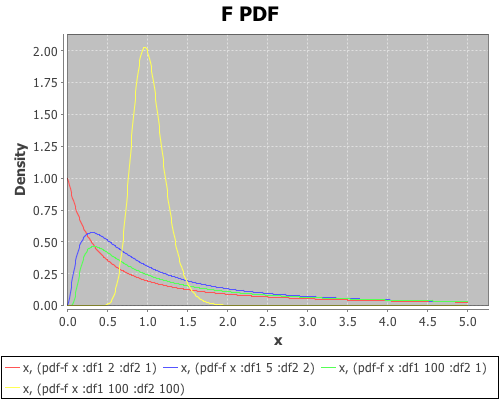
Plots of CDFs of different F distributions
(doto (xy-plot x (cdf-f x :df1 1 :df2 1)
                 :title "F CDF"
                 :y-label "Probability"
                 :legend true)
      (add-lines x (cdf-f x :df1 2 :df2 1))
      (add-lines x (cdf-f x :df1 5 :df2 2))
      (add-lines x (cdf-f x :df1 100 :df2 1))
      (add-lines x (cdf-f x :df1 100 :df2 100))
      view)
Examples of plots from the Binomial Distribution page at Wikipedia.
Plot PDFs of different binomial distributions.
(def x1 (range 0 20))
(def x2 (range 0 40))
(doto (scatter-plot x1 (pdf-binomial x1 :prob 1/2 :size 20)
                    :title "Binomial PDF"
                    :y-label "Density"
                    :legend true)
      (add-points x1 (pdf-binomial x1 :prob 0.7 :size 20))
      (add-points x2 (pdf-binomial x2 :prob 1/2 :size 40))
      view)
Plot CDFs of different binomial distributions.
(doto (scatter-plot x1 (cdf-binomial x1 :prob 1/2 :size 20)
                    :title "Binomial CDF"
                    :y-label "Probability"
                    :legend true)
      (add-points x1 (cdf-binomial x1 :prob 0.7 :size 20))
      (add-points x2 (cdf-binomial x2 :prob 1/2 :size 40))
      view)
Make box-plots for each of the Binomial distributions.
(doto (box-plot (sample-binomial 1000 :prob 1/2 :size 20)
                :title "Binomial Boxplot"
                :legend true)
      (add-box-plot (sample-binomial 1000 :prob 0.7 :size 20))
      (add-box-plot (sample-binomial 1000 :prob 1/2 :size 40))
      view)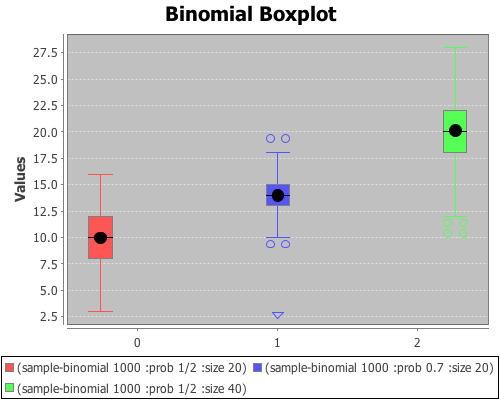
Make a histogram of a sample of 1000 Exponential deviates
(view (histogram (sample-binomial 1000 :prob 1/2 :size 20)
        :title "Binomial Histogram"
        :nbins 10))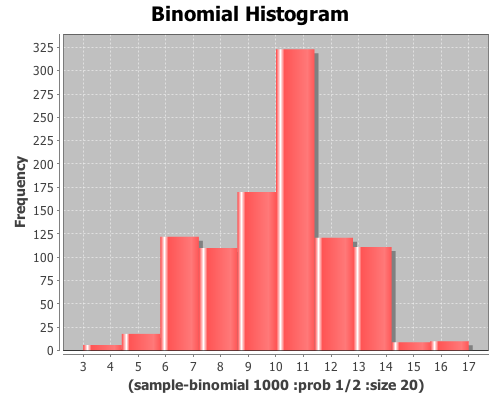
Examples of plots from the Negative Binomial Distribution page at Wikipedia.
Plots of PDFs of different negative binomial distributions.
(def x1 (range 0 100))
(def x2 (range 0 50))
(def x3 (range 0 100))
(doto (scatter-plot x2 (pdf-neg-binomial x2 :prob 1/10 :size 50)
                    :title "Negative Binomial PDF"
                    :y-label "Density"
                    :legend true)
      (add-points x2 (pdf-neg-binomial x2 :prob 1/8 :size 75))
      (add-points x3 (pdf-neg-binomial x3 :prob 1/4 :size 150))
      view)
Plots of CDFs of different negative binomial distributions.
(doto (scatter-plot x1 (cdf-neg-binomial x1 :prob 1/2 :size 25)
                    :title "Negative Binomial CDF"
                    :y-label "Probability"
                    :legend true)
      (add-points x1 (cdf-neg-binomial x1 :prob 2/3 :size 25))
      (add-points x1 (cdf-neg-binomial x1 :prob 3/4 :size 25))
      view)
Make box-plots for each of the Negative Binomial distributions.
(doto (box-plot (sample-neg-binomial 1000 :prob 1/2 :size 20)
                           :title "Negative Binomial Boxplot"
                           :legend true)
      (add-box-plot (sample-neg-binomial 1000 :prob 0.7 :size 20))
      (add-box-plot (sample-neg-binomial 1000 :prob 1/2 :size 40))
      view)
Make a histogram of a sample of 1000 Exponential deviates.
(view (histogram (sample-neg-binomial 1000 :prob 1/4 :size 500)
        :title "Negative Binomial Histogram"
        :nbins 10))
Examples of plots from the Poisson Distribution page at Wikipedia.
Plots of PDFs of different poisson distributions.
(def x1 (range 0 20))
(doto (scatter-plot x1 (pdf-poisson x1 :lambda 1)
                    :title "Poisson PDF"
                    :legend true)
      (add-points x1 (pdf-poisson x1 :lambda 4))
      (add-points x1 (pdf-poisson x1 :lambda 10))
      view)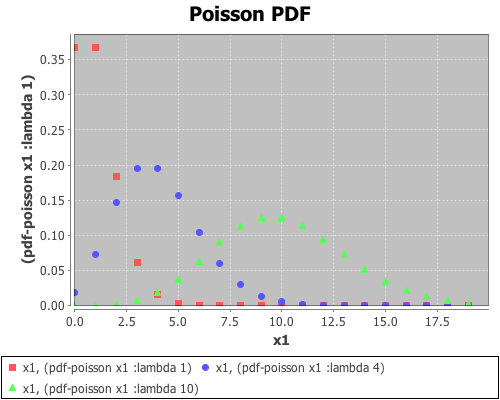
Plots of CDFs of different poisson distributions.
(doto (scatter-plot x1 (cdf-poisson x1 :lambda 1)
                    :title "Poisson CDF"
                    :legend true)
      (add-points x1 (cdf-poisson x1 :lambda 4))
      (add-points x1 (cdf-poisson x1 :lambda 10))
      view)
Make box-plots for each of the Poisson distributions.
(doto (box-plot (sample-poisson 1000 :lambda 1)
                :title "Poisson Boxplot"
                :legend true)
      (add-box-plot (sample-poisson 1000 :lambda 4))
      (add-box-plot (sample-poisson 1000 :lambda 10))
      view)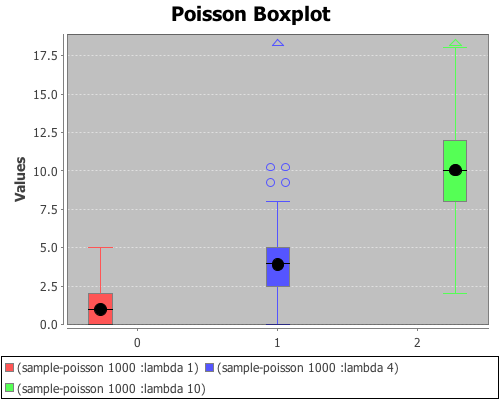
Make a histogram of a sample of 1000 Poisson deviates.
(view (histogram (sample-poisson 1000 :lambda 10)
        :title "Poisson Histogram (lambda)"
        :nbins 10))