HOWTO: Monitoring with the Graphical Environment - ibmcb/cbtool GitHub Wiki
Before you can monitor your experiments, make sure you have followed previous tutorials on how to:
- Connect to Your Cloud with the Graphical Environment
- Interact with the Graphical Environment
- When you're finished with this tutorial, you can try to customize the graphical monitoring dashboard
Monitoring your Benchmarks:
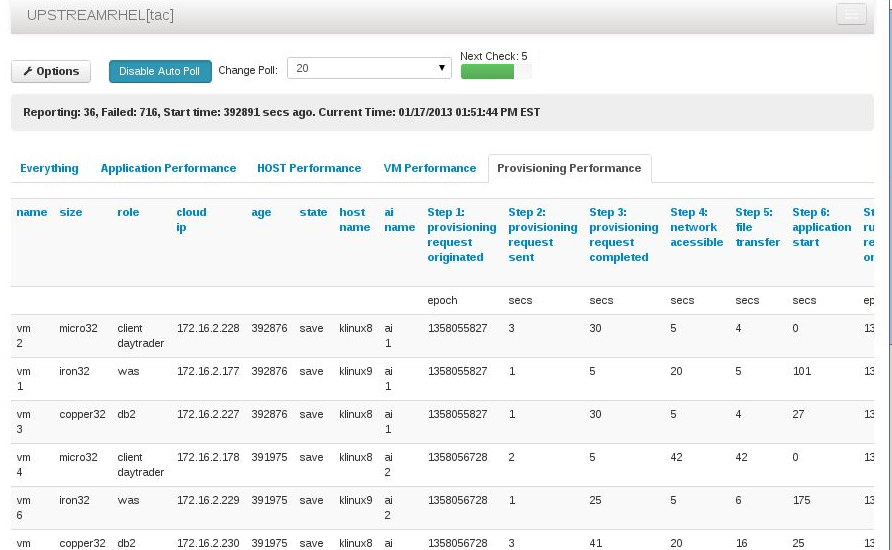
Click on the "Dashboard" tab after you have some VMs or Virtual Applications running:
Here you have several categories of runtime information to choose from:
- Provisioning Metrics
- Application Metrics
- VM operating system metrics (provided by Ganglia)
- Host operating system metrics (if your cloud exposes them)
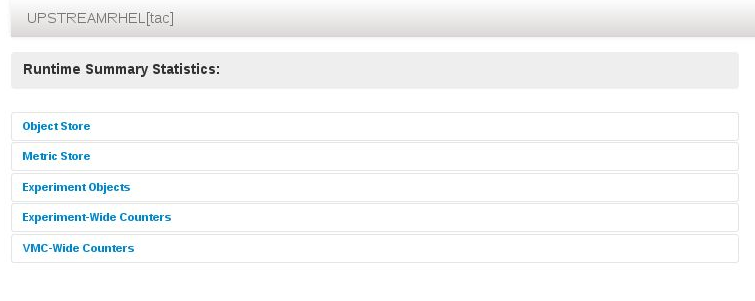
Additional Birds-Eye-View "Statistics"
The framework can potentially have thousands of virtual machines involved in a Benchmark which cannot be easily visualized. If you click on the "Statistics" tab, there are several other lower-level runtime statistics to give a birds-eye view of the running experiment.
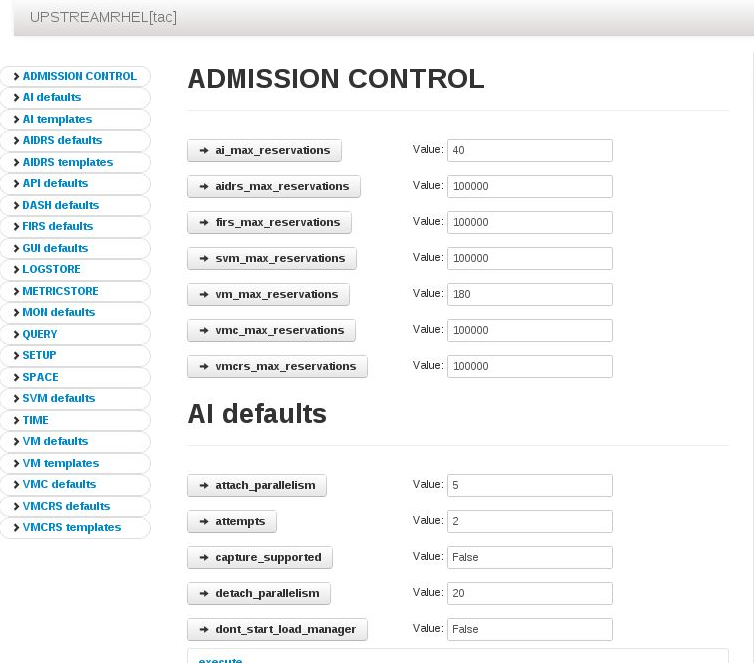
Changing "Configuration" During Runtime:
For more advanced users, the "configuration" tab gives you a direct way to change the parameters of a running experiment during runtime.
For example, you might want to adjust the load-injection parameters of a particular application type or any other configurable parts of the experiment: