Custom Dashboard with Confluence - hilbix/netdata GitHub Wiki
With netdata you can build live, interactive, monitoring dashboards directly on Atlassian's Confluence pages.
I see you already asking "why should I do this?"
Well... think a bit of it.... confluence is the perfect place for something like that:
-
All the employees of your company already have access to it.
-
Most probably you have already several spaces on confluence, one for each project or service. Adding live monitoring information there is ideal: everything in one place. Your users will just click on the page and instantly the monitoring page they need will appear with only the information they need to know.
-
You can create monitoring pages for very specific purposes, hiding all the information that is too detailed for most users, or explaining in detail things that are difficult for them to understand.
So, what can we expect? What can netdata do on confluence?
You will be surprised! Everything a netdata dashboard does!. Example:
Let me show you how.
Let's assume we have 2 web servers we want to monitor. We will create a simple dashboard with key information about them, directly on confluence.
Most likely your confluence is accessible via HTTPS. So, you need to proxy your netdata servers via an apache or nginx to make them HTTPS too. If your Confluence is HTTPS but your netdata are not, you will not be able to fetch the netdata content from the confluence page. The netdata wiki has many examples for proxying netdata through another web server.
So, make sure netdata and confluence can be accessed with the same protocol (http, or https).
For our example, I will use these 2 servers:
| server | url |
|---|---|
| Server 1 | https://london.my-netdata.io |
| Server 2 | https://frankfurt.my-netdata.io |
I will use the first server for the static dashboard javascript files.
Then, you need to enable the html plugin of confluence. We will add some plain html content on that page, and this plugin is required.
Create a new confluence page and paste this into an html box:
<script>
// don't load bootstrap - confluence does not need this
var netdataNoBootstrap = true;

// select the web notifications to show on this dashboard
// var netdataShowAlarms = true;
// var netdataAlarmsRecipients = [ 'sysadmin', 'webmaster' ];
</script>

<script src="https://london.my-netdata.io/dashboard.js"></script>
like this (type {html for the html box to appear - you need the confluence html plugin enabled):

Then, go to your netdata and copy an alarm badge (the <embed> version of it):
Then add another HTML box on the page, and paste it, like this:

Hit update and you will get this:

This badge is now auto-refreshing. It will update itself based on the update frequency of the alarm.
Keep in mind you can add badges with custom netdata queries too. netdata automatically creates badges for all the alarms, but every chart, every dimension on every chart, can be used for a badge. And netdata badges are quite powerful! Check Creating Badges for more information on badges.
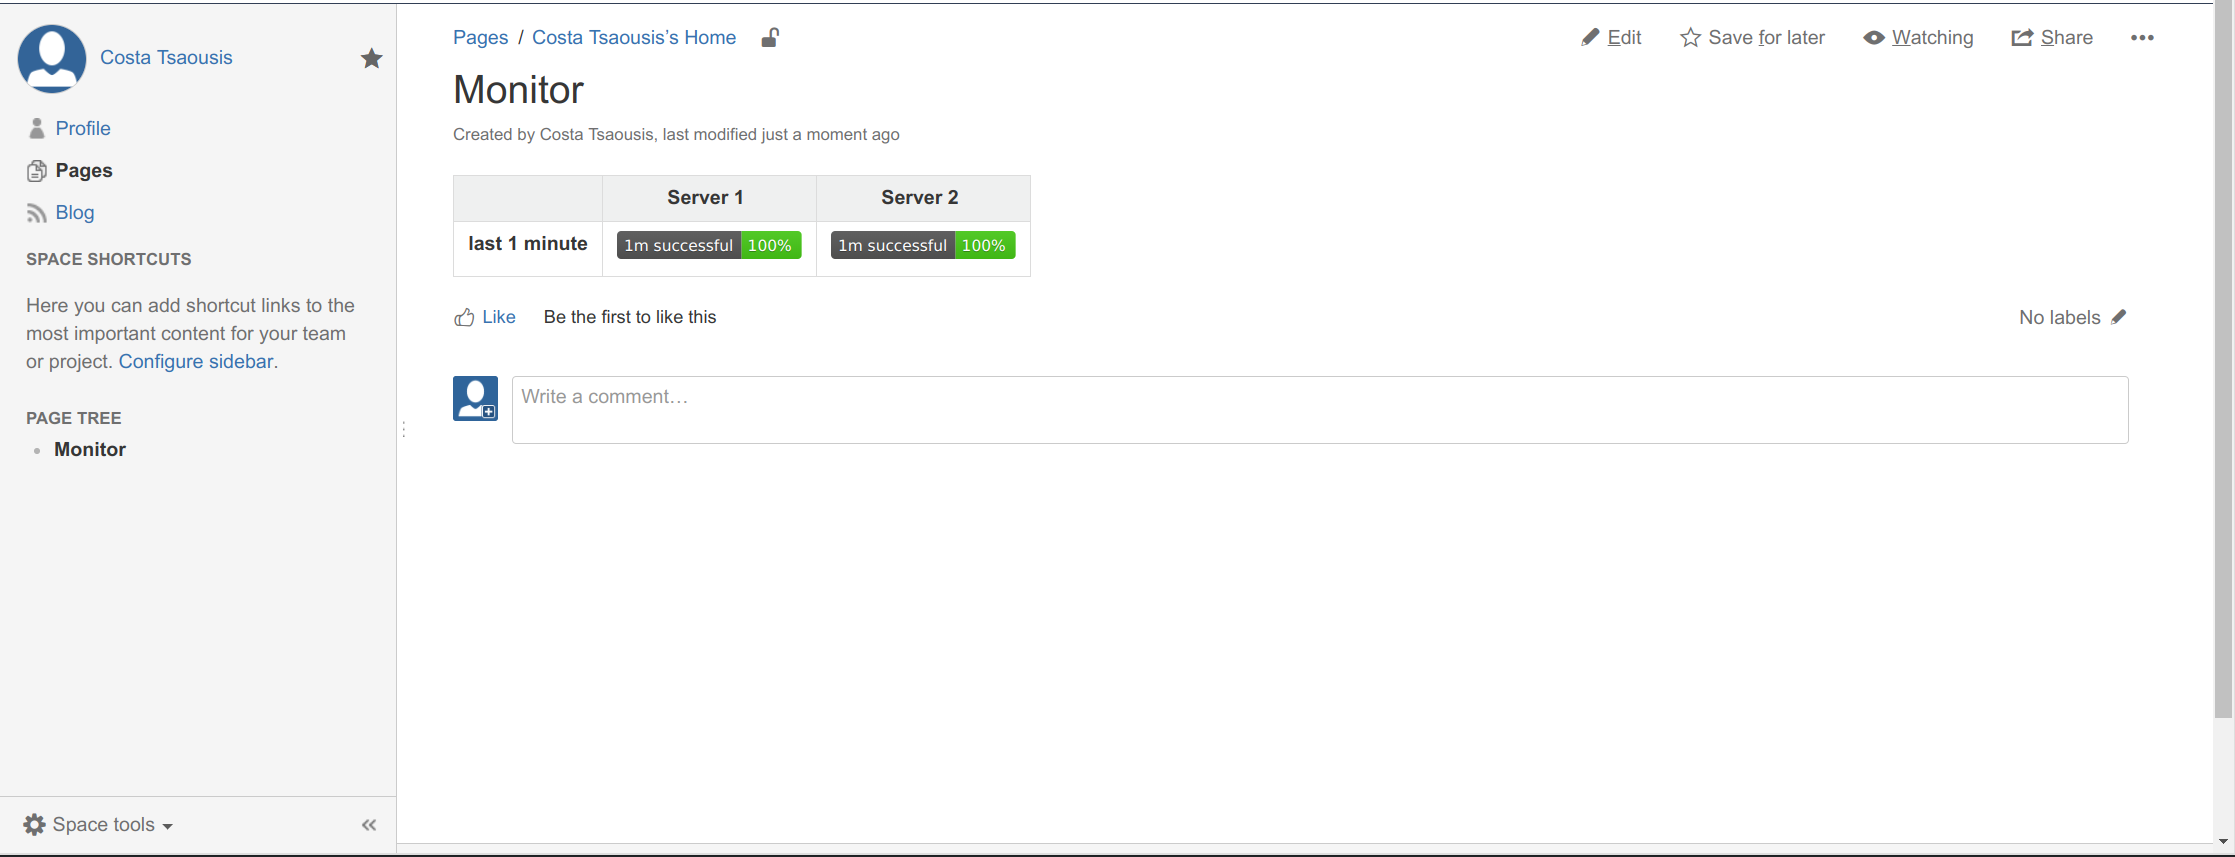
So, let's create a table and add this badge for both our web servers:

Now we get this:
The simplest form of a chart is this (it adds the chart web_log_nginx_netdata.response_statuses, using 100% of the width, 150px height, and the last 10 minutes of data):
<div
    data-netdata="web_log_nginx_netdata.response_statuses"
	data-width="100%"
	data-height="150px"
	data-before="0"
	data-after="-600"
></div>
Add this to html block on confluence:

And you will get this:
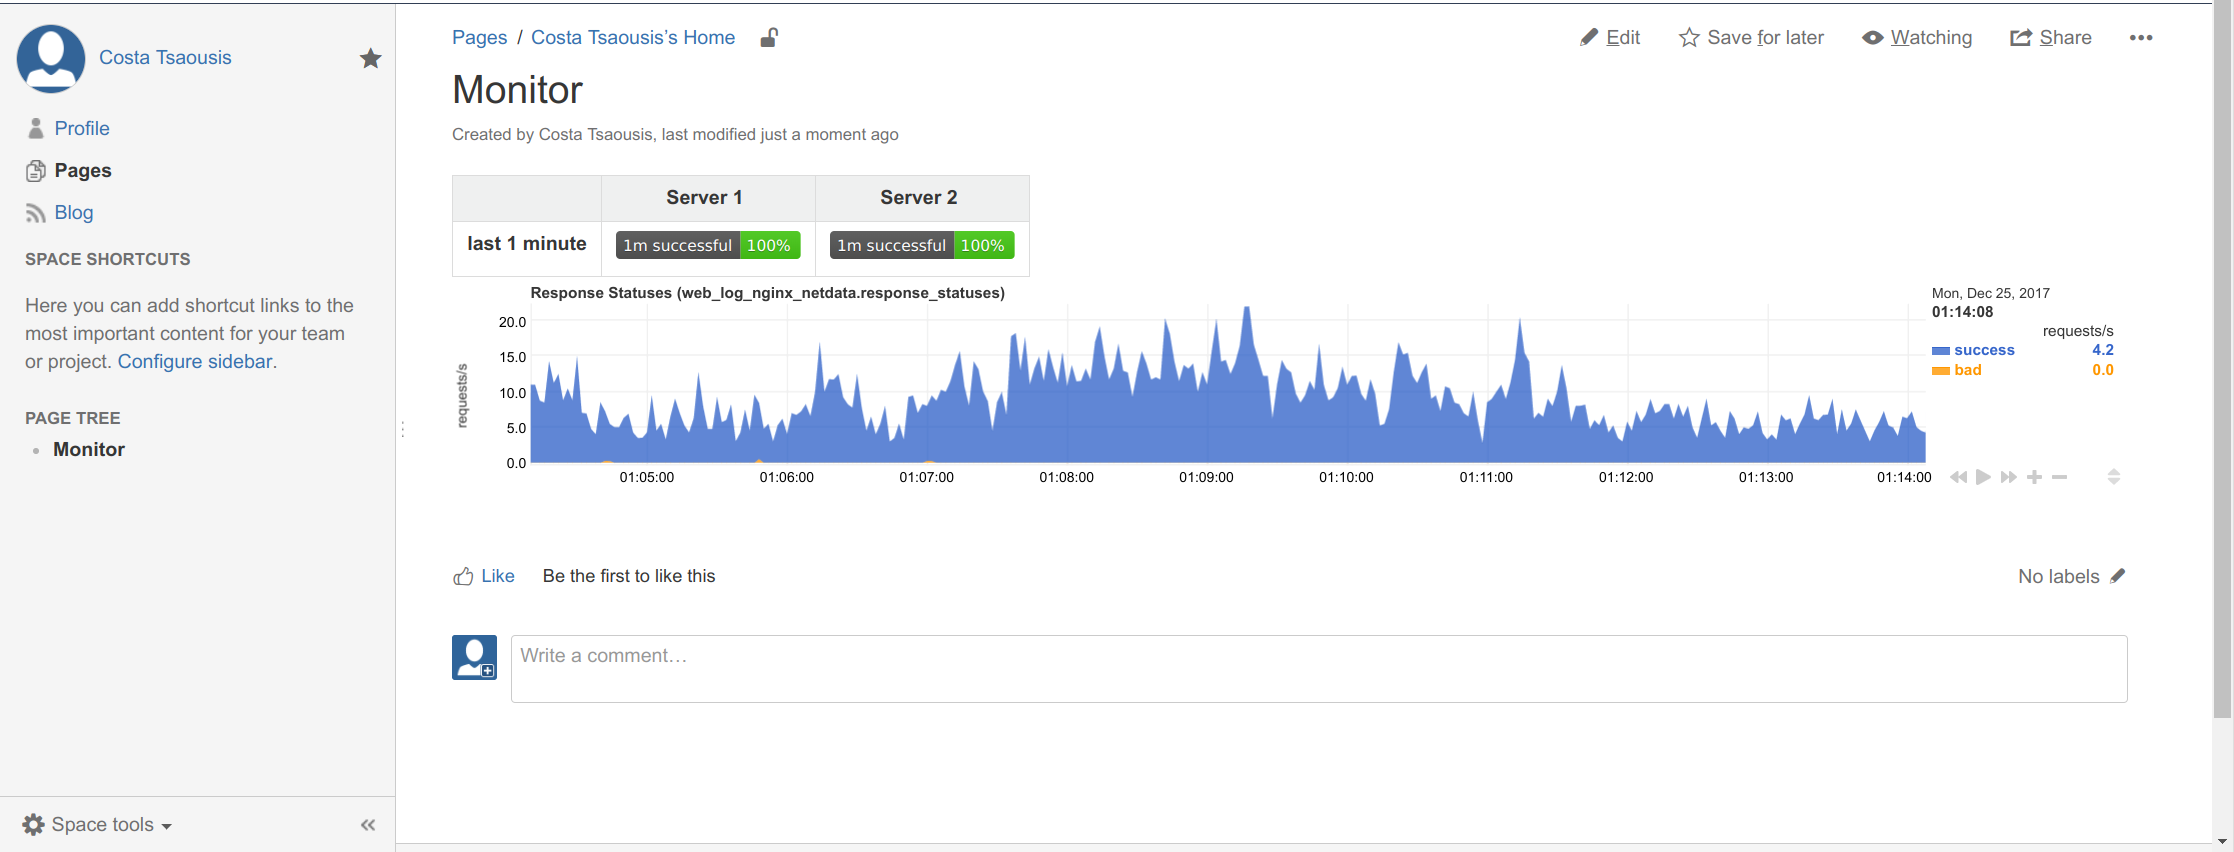
This chart is alive, fully interactive. You can drag it, pan it, zoom it, etc like you do on netdata dashboards!
Of course this too big. We need something smaller to add inside the table. Let's try this:
<div
	data-netdata="web_log_nginx_netdata.response_statuses"
	data-legend="false"
	data-dygraph-yaxislabelwidth="35"
	data-dygraph-ypixelsperlabel="8"
	data-after="-600"
	data-before="0"
	data-title=""
	data-height="100px"
	data-width="300px"
></div>
The chart name is shown on all netdata charts, so just copy it from a netdata dashboard.
We will fetch the same chart from both servers. To define the server we also added data-host= with the URL of each server, like this (we also added <br/> for a newline between the badge and the chart):

Which gives us this:
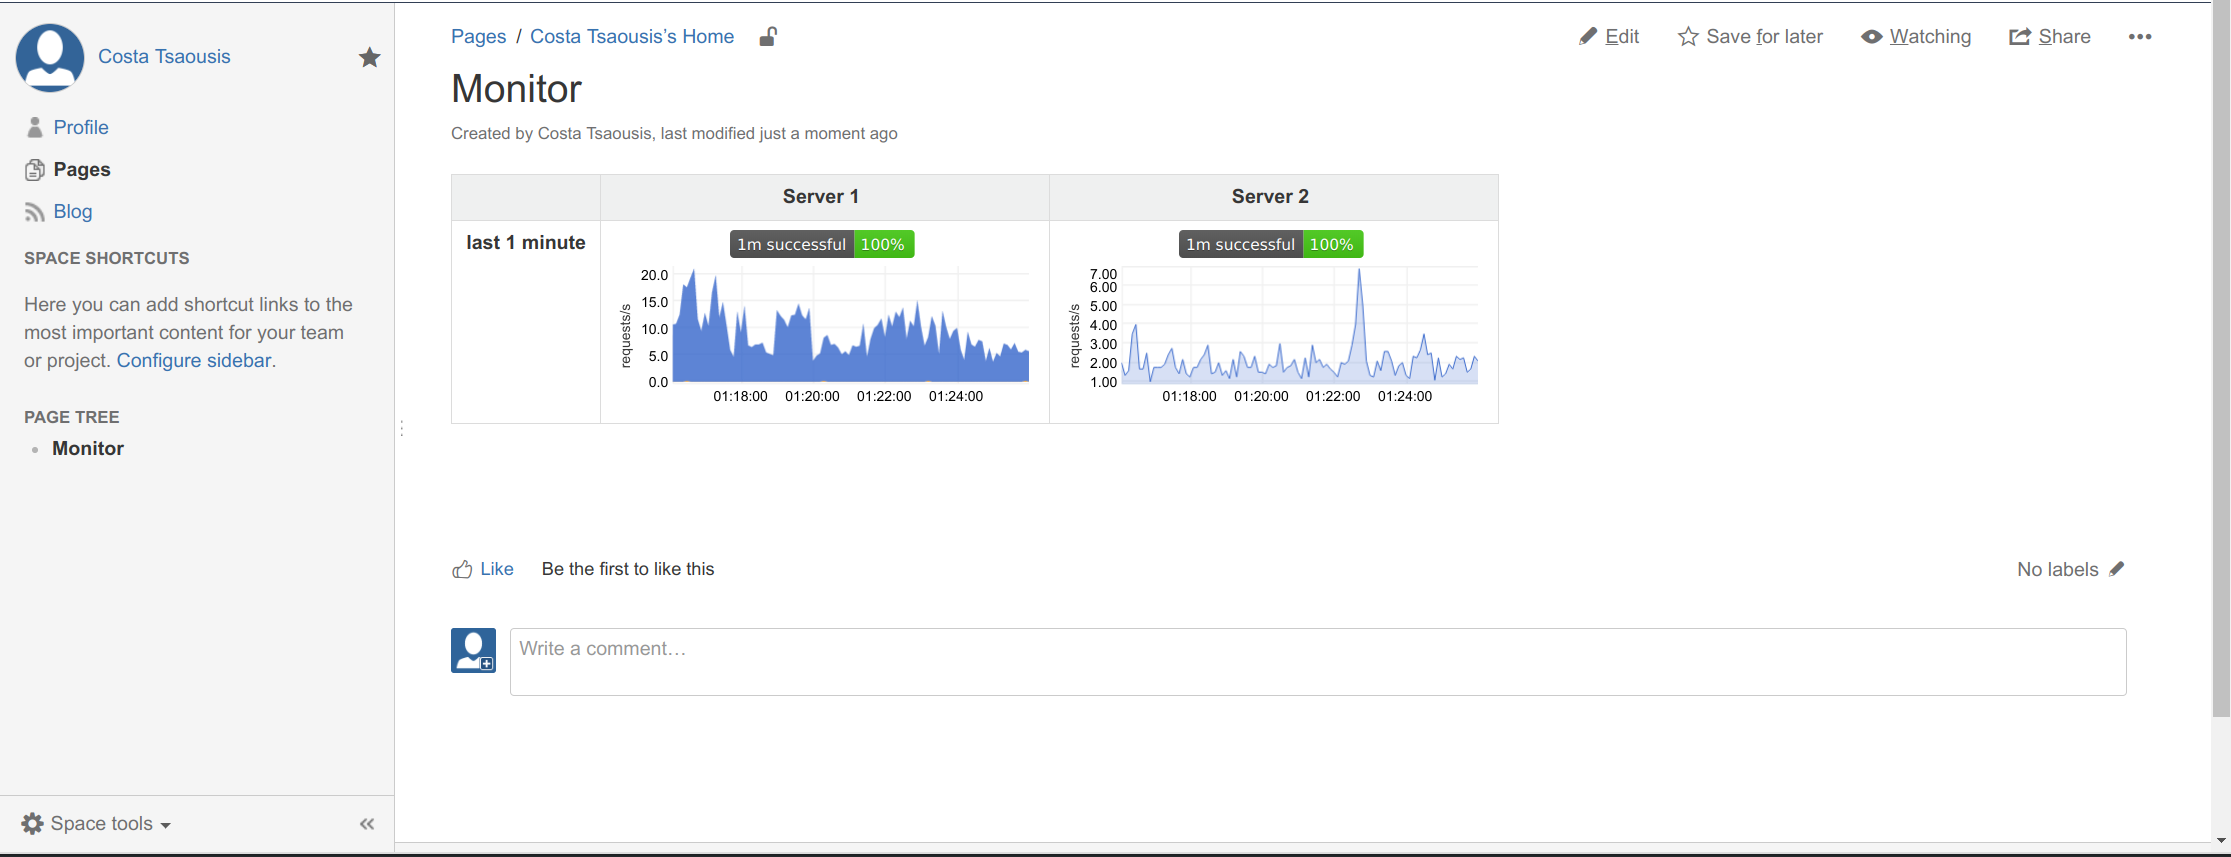
Note the color difference. This is because netdata automatically hides dimensions that are just zero (the frankfurt server has only successful requests). To instruct netdata to disable this feature, we need to add another html fragment at the bottom of the page (make sure this is added after loading dashboard.js). So we edit the first block we added, and append a new <script> section to it:
<script>
// don't load bootstrap - confluence does not need this
var netdataNoBootstrap = true;

// select the web notifications to show on this dashboard
// var netdataShowAlarms = true;
// var netdataAlarmsRecipients = [ 'sysadmin', 'webmaster' ];
</script>

<script src="https://london.my-netdata.io/dashboard.js"></script>

<script>
// do not hide dimensions with just zeros
NETDATA.options.current.eliminate_zero_dimensions = false;
</script>
Now they match:

If you want to change the colors append data-colors="#001122 #334455 #667788". The colors will be used for the dimensions top to bottom, as shown on a netdata dashboard. Keep in mind the default netdata dashboards hide by default all dimensions that are just zero, so enable them at the dashboard settings to see them all.
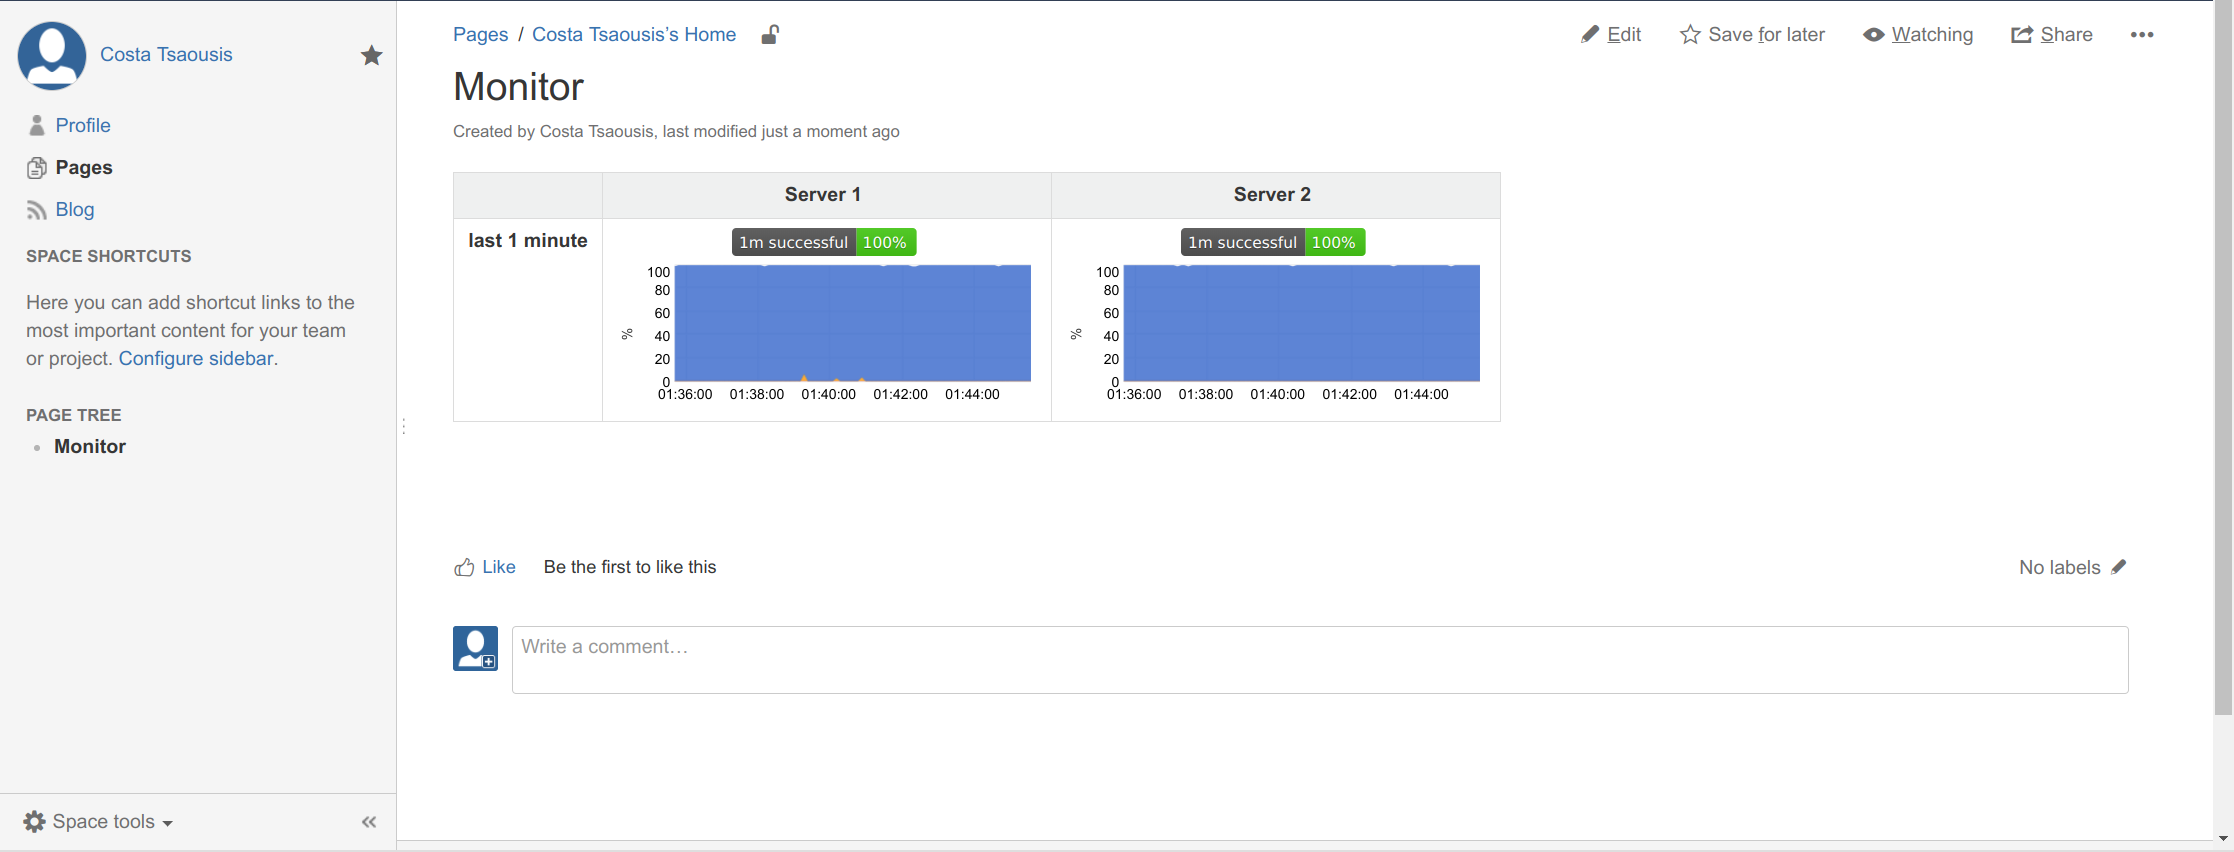
You can get a percentage chart, by adding these on these charts:
	data-append-options="percentage"
	data-decimal-digits="0"
	data-dygraph-valuerange="[0, 100]"
	data-dygraph-includezero="true"
	data-units="%"
The first line instructs netdata to calculate the percentage of each dimension, the second strips any fractional digits, the third instructs the charting library to size the chart from 0 to 100, the next one instructs it to include 0 in the chart and the last changes the units of the chart to %. This is how it will look:
You can make any number of charts have common min and max on the y-range by adding common-min="NAME" and common-max="NAME", where NAME is anything you like. Keep in mind for best results all the charts with the same NAME should be visible at once, otherwise a not-visible chart will influence the range and until it is updated the range will not adapt.
Let's now add a few gauges. The chart we added has several dimensions: success, error, redirect, bad and other.
Let's say we want to add 2 gauges:
-
successandredirecttogether, in blue -
error,badandothertogether, in orange
We will add the following for each server. We have enclosed them in another a <div> because Confluence will wrap them if the page width is not enough to fit them. With that additional <div> they will always be next to each other.
<div style="width: 300px; text-align: center;">
<div
		data-netdata="web_log_nginx_netdata.response_statuses"
		data-host="https://london.my-netdata.io"
		data-dimensions="success,redirect"
		data-chart-library="gauge"
		data-title="Good"
		data-units="requests/s"
		data-gauge-adjust="width"
		data-width="120"
		data-before="0"
		data-after="-600"
		data-points="600"
		data-common-max="response_statuses"
		data-colors="#007ec6"
		data-decimal-digits="0"
	></div><div
		data-netdata="web_log_nginx_netdata.response_statuses"
		data-host="https://london.my-netdata.io"
		data-dimensions="error,bad,other"
		data-chart-library="gauge"
		data-title="Bad"
		data-units="requests/s"
		data-gauge-adjust="width"
		data-width="120"
		data-before="0"
		data-after="-600"
		data-points="600"
		data-common-max="response_statuses"
		data-colors="#97CA00"
		data-decimal-digits="0"
	></div>
</div>
Adding the above will give you this:
If you enable the source editor of Confluence, you can paste the whole example (implementing the first image on this post and demonstrating everything discussed on this page):
<p class="auto-cursor-target">Monitoring the health of the web servers, by analyzing the response codes they send.</p>
<table>
<colgroup>
<col/>
<col/>
<col/>
<col/>
<col/>
</colgroup>
<tbody>
<tr>
<th style="text-align: center;">
<br/>
</th>
<th style="text-align: center;">London</th>
<th style="text-align: center;">Frankfurt</th>
<th colspan="1" style="text-align: center;">San Francisco</th>
<th colspan="1" style="text-align: center;">Toronto</th>
</tr>
<tr>
<td colspan="1" style="text-align: right;">
<strong>last hour</strong>
<br/>
<strong>requests</strong>
</td>
<td colspan="1" style="text-align: center;">
<div class="content-wrapper">
<p class="auto-cursor-target">
<br/>
</p>
<ac:structured-macro ac:macro-id="5771a1db-b461-478f-a820-edcb67809eb1" ac:name="html" ac:schema-version="1">
<ac:plain-text-body><![CDATA[<div
data-netdata="web_log_nginx_netdata.response_statuses"
data-host="https://london.my-netdata.io"
data-chart-library="easypiechart"
data-after="-14400"
data-before="0"
data-points="4"
data-title="london"
data-method="sum"
data-append-options="unaligned"
data-update-every="60"
data-width="120px"
data-common-max="1h_requests_pie"
data-decimal-digits="0"
></div>]]></ac:plain-text-body>
</ac:structured-macro>
<p class="auto-cursor-target">
<br/>
</p>
</div>
</td>
<td colspan="1" style="text-align: center;">
<div class="content-wrapper">
<p class="auto-cursor-target">
<br/>
</p>
<ac:structured-macro ac:macro-id="aff4446a-1432-407b-beb0-488c33eced18" ac:name="html" ac:schema-version="1">
<ac:plain-text-body><![CDATA[<div
data-netdata="web_log_nginx_netdata.response_statuses"
data-host="https://frankfurt.my-netdata.io"
data-chart-library="easypiechart"
data-after="-14400"
data-before="0"
data-points="4"
data-title="frankfurt"
data-method="sum"
data-append-options="unaligned"
data-update-every="60"
data-width="120px"
data-common-max="1h_requests_pie"
data-decimal-digits="0"
></div>]]></ac:plain-text-body>
</ac:structured-macro>
<p class="auto-cursor-target">
<br/>
</p>
</div>
</td>
<td colspan="1" style="text-align: center;">
<div class="content-wrapper">
<p class="auto-cursor-target">
<br/>
</p>
<ac:structured-macro ac:macro-id="fd310534-627c-47bd-a184-361eb3f00489" ac:name="html" ac:schema-version="1">
<ac:plain-text-body><![CDATA[<div
data-netdata="web_log_nginx_netdata.response_statuses"
data-host="https://sanfrancisco.my-netdata.io"
data-chart-library="easypiechart"
data-after="-14400"
data-before="0"
data-points="4"
data-title="sanfrancisco"
data-method="sum"
data-append-options="unaligned"
data-update-every="60"
data-width="120px"
data-common-max="1h_requests_pie"
data-decimal-digits="0"
></div>]]></ac:plain-text-body>
</ac:structured-macro>
<p class="auto-cursor-target">
<br/>
</p>
</div>
</td>
<td colspan="1" style="text-align: center;">
<div class="content-wrapper">
<p class="auto-cursor-target">
<br/>
</p>
<ac:structured-macro ac:macro-id="eb1261d5-8ff2-4a5c-8945-701bf04fb75b" ac:name="html" ac:schema-version="1">
<ac:plain-text-body><![CDATA[<div
data-netdata="web_log_nginx_netdata.response_statuses"
data-host="https://toronto.my-netdata.io"
data-chart-library="easypiechart"
data-after="-14400"
data-before="0"
data-points="4"
data-title="toronto"
data-method="sum"
data-append-options="unaligned"
data-update-every="60"
data-width="120px"
data-common-max="1h_requests_pie"
data-decimal-digits="0"
></div>]]></ac:plain-text-body>
</ac:structured-macro>
<p class="auto-cursor-target">
<br/>
</p>
</div>
</td>
</tr>
<tr>
<td colspan="1" style="text-align: right;">
<strong>last<br/>1 hour</strong>
</td>
<td colspan="1" style="text-align: center;">
<div class="content-wrapper">
<p class="auto-cursor-target">
<br/>
</p>
<ac:structured-macro ac:macro-id="d2ee8425-2c6c-4e26-8c5a-17f6153fdce1" ac:name="html" ac:schema-version="1">
<ac:plain-text-body><![CDATA[<div
data-netdata="web_log_nginx_netdata.response_statuses"
data-host="https://london.my-netdata.io"
data-legend="false"
data-dygraph-yaxislabelwidth="35"
data-dygraph-ypixelsperlabel="8"
data-dygraph-xpixelsperlabel="30"
data-dygraph-xaxislabelwidth="26"
data-after="-3600"
data-before="0"
data-title=""
data-height="100px"
data-width="300px"
data-common-max="1h_requests"
data-decimal-digits="0"
></div>]]></ac:plain-text-body>
</ac:structured-macro>
<p class="auto-cursor-target">
<br/>
</p>
</div>
</td>
<td colspan="1" style="text-align: center;">
<div class="content-wrapper">
<p class="auto-cursor-target">
<br/>
</p>
<ac:structured-macro ac:macro-id="b3fb482a-4e9e-4b69-bb0b-9885d1687334" ac:name="html" ac:schema-version="1">
<ac:plain-text-body><![CDATA[<div
data-netdata="web_log_nginx_netdata.response_statuses"
data-host="https://frankfurt.my-netdata.io"
data-legend="false"
data-dygraph-yaxislabelwidth="35"
data-dygraph-ypixelsperlabel="8"
data-dygraph-xpixelsperlabel="30"
data-dygraph-xaxislabelwidth="26"
data-after="-3600"
data-before="0"
data-title=""
data-height="100px"
data-width="300px"
data-common-max="1h_requests"
data-decimal-digits="0"
></div>]]></ac:plain-text-body>
</ac:structured-macro>
<p class="auto-cursor-target">
<br/>
</p>
</div>
</td>
<td colspan="1" style="text-align: center;">
<div class="content-wrapper">
<p class="auto-cursor-target">
<br/>
</p>
<ac:structured-macro ac:macro-id="199b1618-64be-4614-9662-f84cd01c6d8d" ac:name="html" ac:schema-version="1">
<ac:plain-text-body><![CDATA[<div
data-netdata="web_log_nginx_netdata.response_statuses"
data-host="https://sanfrancisco.my-netdata.io"
data-legend="false"
data-dygraph-yaxislabelwidth="35"
data-dygraph-ypixelsperlabel="8"
data-dygraph-xpixelsperlabel="30"
data-dygraph-xaxislabelwidth="26"
data-after="-3600"
data-before="0"
data-title=""
data-height="100px"
data-width="300px"
data-common-max="1h_requests"
data-decimal-digits="0"
></div>]]></ac:plain-text-body>
</ac:structured-macro>
<p class="auto-cursor-target">
<br/>
</p>
</div>
</td>
<td colspan="1" style="text-align: center;">
<div class="content-wrapper">
<p class="auto-cursor-target">
<br/>
</p>
<ac:structured-macro ac:macro-id="61b2d444-fb2b-42e0-b4eb-611fb37dcb66" ac:name="html" ac:schema-version="1">
<ac:plain-text-body><![CDATA[<div
data-netdata="web_log_nginx_netdata.response_statuses"
data-host="https://toronto.my-netdata.io"
data-legend="false"
data-dygraph-yaxislabelwidth="35"
data-dygraph-ypixelsperlabel="8"
data-dygraph-xpixelsperlabel="30"
data-dygraph-xaxislabelwidth="26"
data-after="-3600"
data-before="0"
data-title=""
data-height="100px"
data-width="300px"
data-common-max="1h_requests"
data-decimal-digits="0"
></div>]]></ac:plain-text-body>
</ac:structured-macro>
<p class="auto-cursor-target">
<br/>
</p>
</div>
</td>
</tr>
<tr>
<td colspan="1" style="text-align: right;">
<strong>last 10<br/>minutes</strong>
</td>
<td colspan="1" style="text-align: center;">
<div class="content-wrapper">
<p class="auto-cursor-target">
<br/>
</p>
<ac:structured-macro ac:macro-id="f29e7663-f2e6-4e1d-a090-38704e0f2bd3" ac:name="html" ac:schema-version="1">
<ac:plain-text-body><![CDATA[<div
data-netdata="web_log_nginx_netdata.response_statuses"
data-host="https://london.my-netdata.io"
data-legend="false"
data-dygraph-yaxislabelwidth="35"
data-dygraph-ypixelsperlabel="8"
data-after="-600"
data-before="0"
data-title=""
data-height="100px"
data-width="300px"
data-common-max="10m_requests"
data-decimal-digits="0"
></div>]]></ac:plain-text-body>
</ac:structured-macro>
<p class="auto-cursor-target">
<br/>
</p>
</div>
</td>
<td colspan="1" style="text-align: center;">
<div class="content-wrapper">
<p class="auto-cursor-target">
<br/>
</p>
<ac:structured-macro ac:macro-id="245ccc90-1505-430b-ba13-15e6a9793c11" ac:name="html" ac:schema-version="1">
<ac:plain-text-body><![CDATA[<div
data-netdata="web_log_nginx_netdata.response_statuses"
data-host="https://frankfurt.my-netdata.io"
data-legend="false"
data-dygraph-yaxislabelwidth="35"
data-dygraph-ypixelsperlabel="8"
data-after="-600"
data-before="0"
data-title=""
data-height="100px"
data-width="300px"
data-common-max="10m_requests"
data-decimal-digits="0"
></div>]]></ac:plain-text-body>
</ac:structured-macro>
<p class="auto-cursor-target">
<br/>
</p>
</div>
</td>
<td colspan="1" style="text-align: center;">
<div class="content-wrapper">
<p class="auto-cursor-target">
<br/>
</p>
<ac:structured-macro ac:macro-id="864ff17f-f372-47e4-9d57-54e44b142240" ac:name="html" ac:schema-version="1">
<ac:plain-text-body><![CDATA[<div
data-netdata="web_log_nginx_netdata.response_statuses"
data-host="https://sanfrancisco.my-netdata.io"
data-legend="false"
data-dygraph-yaxislabelwidth="35"
data-dygraph-ypixelsperlabel="8"
data-after="-600"
data-before="0"
data-title=""
data-height="100px"
data-width="300px"
data-common-max="10m_requests"
data-decimal-digits="0"
></div>]]></ac:plain-text-body>
</ac:structured-macro>
<p class="auto-cursor-target">
<br/>
</p>
</div>
</td>
<td colspan="1" style="text-align: center;">
<div class="content-wrapper">
<p class="auto-cursor-target">
<br/>
</p>
<ac:structured-macro ac:macro-id="e0072f2b-0169-4ecf-8ddf-724270d185b8" ac:name="html" ac:schema-version="1">
<ac:plain-text-body><![CDATA[<div
data-netdata="web_log_nginx_netdata.response_statuses"
data-host="https://toronto.my-netdata.io"
data-legend="false"
data-dygraph-yaxislabelwidth="35"
data-dygraph-ypixelsperlabel="8"
data-after="-600"
data-before="0"
data-title=""
data-height="100px"
data-width="300px"
data-common-max="10m_requests"
data-decimal-digits="0"
></div>]]></ac:plain-text-body>
</ac:structured-macro>
<p class="auto-cursor-target">
<br/>
</p>
</div>
</td>
</tr>
<tr>
<td style="text-align: right;">
<strong>last 1<br/>minute</strong>
</td>
<td style="text-align: center;">
<div class="content-wrapper">
<p class="auto-cursor-target">
<br/>
</p>
<ac:structured-macro ac:macro-id="8c041cfb-a5a0-425c-afe6-207f4986cb26" ac:name="html" ac:schema-version="1">
<ac:plain-text-body><![CDATA[<embed src="https://london.my-netdata.io/api/v1/badge.svg?chart=web_log_nginx_netdata.response_statuses&alarm=1m_successful&refresh=auto&label=1m%20london%20successful%20requests" type="image/svg+xml" height="20"/>
<br/>
<div
data-netdata="web_log_nginx_netdata.response_statuses"
data-host="https://london.my-netdata.io"
data-legend="false"
data-dygraph-yaxislabelwidth="35"
data-dygraph-ypixelsperlabel="8"
data-after="-60"
data-before="0"
data-title=""
data-height="100px"
data-width="300px"
data-append-options="percentage"
data-decimal-digits="0"
data-dygraph-valuerange="[0, 100]"
data-dygraph-includezero="true"
data-units="%"
data-dimensions="success"
data-colors="#009900"
></div>]]></ac:plain-text-body>
</ac:structured-macro>
<p class="auto-cursor-target">
<br/>
</p>
</div>
</td>
<td style="text-align: center;">
<div class="content-wrapper">
<p class="auto-cursor-target">
<br/>
</p>
<ac:structured-macro ac:macro-id="a3777583-9919-4997-891c-94a8cec60604" ac:name="html" ac:schema-version="1">
<ac:plain-text-body><![CDATA[<embed src="https://frankfurt.my-netdata.io/api/v1/badge.svg?chart=web_log_nginx_netdata.response_statuses&alarm=1m_successful&refresh=auto&label=1m%20frankfurt%20successful%20requests" type="image/svg+xml" height="20"/>
<br/>
<div
data-netdata="web_log_nginx_netdata.response_statuses"
data-host="https://frankfurt.my-netdata.io"
data-legend="false"
data-dygraph-yaxislabelwidth="35"
data-dygraph-ypixelsperlabel="8"
data-after="-60"
data-before="0"
data-title=""
data-height="100px"
data-width="300px"
data-append-options="percentage"
data-decimal-digits="0"
data-dygraph-valuerange="[0, 100]"
data-dygraph-includezero="true"
data-units="%"
data-dimensions="success"
data-colors="#009900"
></div>]]></ac:plain-text-body>
</ac:structured-macro>
<p class="auto-cursor-target">
<br/>
</p>
</div>
</td>
<td colspan="1" style="text-align: center;">
<div class="content-wrapper">
<p class="auto-cursor-target">
<br/>
</p>
<ac:structured-macro ac:macro-id="e003deba-82fa-4aec-8264-6cb7d814a299" ac:name="html" ac:schema-version="1">
<ac:plain-text-body><![CDATA[<embed src="https://sanfrancisco.my-netdata.io/api/v1/badge.svg?chart=web_log_nginx_netdata.response_statuses&alarm=1m_successful&refresh=auto&label=1m%20sanfrancisco%20successful%20requests" type="image/svg+xml" height="20"/>
<br/>
<div
data-netdata="web_log_nginx_netdata.response_statuses"
data-host="https://sanfrancisco.my-netdata.io"
data-legend="false"
data-dygraph-yaxislabelwidth="35"
data-dygraph-ypixelsperlabel="8"
data-after="-60"
data-before="0"
data-title=""
data-height="100px"
data-width="300px"
data-append-options="percentage"
data-decimal-digits="0"
data-dygraph-valuerange="[0, 100]"
data-dygraph-includezero="true"
data-units="%"
data-dimensions="success"
data-colors="#009900"
></div>]]></ac:plain-text-body>
</ac:structured-macro>
<p class="auto-cursor-target">
<br/>
</p>
</div>
</td>
<td colspan="1" style="text-align: center;">
<div class="content-wrapper">
<p class="auto-cursor-target">
<br/>
</p>
<ac:structured-macro ac:macro-id="046fcda5-98db-4776-8c51-3981d0e68f38" ac:name="html" ac:schema-version="1">
<ac:plain-text-body><![CDATA[<embed src="https://toronto.my-netdata.io/api/v1/badge.svg?chart=web_log_nginx_netdata.response_statuses&alarm=1m_successful&refresh=auto&label=1m%20toronto%20successful%20requests" type="image/svg+xml" height="20"/>
<br/>
<div
data-netdata="web_log_nginx_netdata.response_statuses"
data-host="https://toronto.my-netdata.io"
data-legend="false"
data-dygraph-yaxislabelwidth="35"
data-dygraph-ypixelsperlabel="8"
data-after="-60"
data-before="0"
data-title=""
data-height="100px"
data-width="300px"
data-append-options="percentage"
data-decimal-digits="0"
data-dygraph-valuerange="[0, 100]"
data-dygraph-includezero="true"
data-units="%"
data-dimensions="success"
data-colors="#009900"
></div>]]></ac:plain-text-body>
</ac:structured-macro>
<p class="auto-cursor-target">
<br/>
</p>
</div>
</td>
</tr>
<tr>
<td colspan="1" style="text-align: right;">
<strong>now</strong>
</td>
<td colspan="1" style="text-align: left;">
<div class="content-wrapper">
<p class="auto-cursor-target">
<br/>
</p>
<ac:structured-macro ac:macro-id="4aef31d3-9439-439b-838d-7350a26bde5f" ac:name="html" ac:schema-version="1">
<ac:plain-text-body><![CDATA[<div style="width: 300px; text-align: center;">
<div
data-netdata="web_log_nginx_netdata.response_statuses"
data-host="https://london.my-netdata.io"
data-dimensions="success"
data-chart-library="gauge"
data-title="Success"
data-units="requests/s"
data-gauge-adjust="width"
data-width="120"
data-before="0"
data-after="-60"
data-points="60"
data-common-max="response_statuses"
data-colors="#009900"
data-decimal-digits="0"
></div><div
data-netdata="web_log_nginx_netdata.response_statuses"
data-host="https://london.my-netdata.io"
data-dimensions="redirect,error,bad,other"
data-chart-library="gauge"
data-title="All Others"
data-units="requests/s"
data-gauge-adjust="width"
data-width="120"
data-before="0"
data-after="-60"
data-points="60"
data-common-max="response_statuses"
data-colors="#fe7d37"
data-decimal-digits="0"
></div>
</div>
<br/>
<div
data-netdata="web_log_nginx_netdata.response_statuses"
data-host="https://london.my-netdata.io"
data-dygraph-theme="sparkline"
data-width="300"
data-height="20"
data-before="0"
data-after="-60"
data-points="60"
data-common-max="1m_requests_sparkline"
></div>]]></ac:plain-text-body>
</ac:structured-macro>
<p class="auto-cursor-target">
<br/>
</p>
</div>
</td>
<td colspan="1" style="text-align: left;">
<div class="content-wrapper">
<p class="auto-cursor-target">
<br/>
</p>
<ac:structured-macro ac:macro-id="bf9fb1c4-ceaf-4ad8-972e-a64d23eb48f8" ac:name="html" ac:schema-version="1">
<ac:plain-text-body><![CDATA[<div style="width: 300px; text-align: center;">
<div
data-netdata="web_log_nginx_netdata.response_statuses"
data-host="https://frankfurt.my-netdata.io"
data-dimensions="success"
data-chart-library="gauge"
data-title="Success"
data-units="requests/s"
data-gauge-adjust="width"
data-width="120"
data-before="0"
data-after="-60"
data-points="60"
data-common-max="response_statuses"
data-colors="#009900"
data-decimal-digits="0"
></div><div
data-netdata="web_log_nginx_netdata.response_statuses"
data-host="https://frankfurt.my-netdata.io"
data-dimensions="redirect,error,bad,other"
data-chart-library="gauge"
data-title="All Others"
data-units="requests/s"
data-gauge-adjust="width"
data-width="120"
data-before="0"
data-after="-60"
data-points="60"
data-common-max="response_statuses"
data-colors="#fe7d37"
data-decimal-digits="0"
></div>
</div>
<br/>
<div
data-netdata="web_log_nginx_netdata.response_statuses"
data-host="https://frankfurt.my-netdata.io"
data-dygraph-theme="sparkline"
data-width="300"
data-height="20"
data-before="0"
data-after="-60"
data-points="60"
data-common-max="1m_requests_sparkline"
></div>]]></ac:plain-text-body>
</ac:structured-macro>
<p class="auto-cursor-target">
<br/>
</p>
</div>
</td>
<td colspan="1">
<div class="content-wrapper">
<p class="auto-cursor-target">
<br/>
</p>
<ac:structured-macro ac:macro-id="60b4c9bc-353a-4e64-b7c8-365ae74156c4" ac:name="html" ac:schema-version="1">
<ac:plain-text-body><![CDATA[<div style="width: 300px; text-align: center;">
<div
data-netdata="web_log_nginx_netdata.response_statuses"
data-host="https://sanfrancisco.my-netdata.io"
data-dimensions="success"
data-chart-library="gauge"
data-title="Success"
data-units="requests/s"
data-gauge-adjust="width"
data-width="120"
data-before="0"
data-after="-60"
data-points="60"
data-common-max="response_statuses"
data-colors="#009900"
data-decimal-digits="0"
></div><div
data-netdata="web_log_nginx_netdata.response_statuses"
data-host="https://sanfrancisco.my-netdata.io"
data-dimensions="redirect,error,bad,other"
data-chart-library="gauge"
data-title="All Others"
data-units="requests/s"
data-gauge-adjust="width"
data-width="120"
data-before="0"
data-after="-60"
data-points="60"
data-common-max="response_statuses"
data-colors="#fe7d37"
data-decimal-digits="0"
></div>
</div>
<br/>
<div
data-netdata="web_log_nginx_netdata.response_statuses"
data-host="https://sanfrancisco.my-netdata.io"
data-dygraph-theme="sparkline"
data-width="300"
data-height="20"
data-before="0"
data-after="-60"
data-points="60"
data-common-max="1m_requests_sparkline"
></div>]]></ac:plain-text-body>
</ac:structured-macro>
<p class="auto-cursor-target">
<br/>
</p>
</div>
</td>
<td colspan="1">
<div class="content-wrapper">
<p class="auto-cursor-target">
<br/>
</p>
<ac:structured-macro ac:macro-id="75e03235-9681-4aaf-bd85-b0ffbb9e3602" ac:name="html" ac:schema-version="1">
<ac:plain-text-body><![CDATA[<div style="width: 300px; text-align: center;">
<div
data-netdata="web_log_nginx_netdata.response_statuses"
data-host="https://toronto.my-netdata.io"
data-dimensions="success"
data-chart-library="gauge"
data-title="Success"
data-units="requests/s"
data-gauge-adjust="width"
data-width="120"
data-before="0"
data-after="-60"
data-points="60"
data-common-max="response_statuses"
data-colors="#009900"
data-decimal-digits="0"
></div><div
data-netdata="web_log_nginx_netdata.response_statuses"
data-host="https://toronto.my-netdata.io"
data-dimensions="redirect,error,bad,other"
data-chart-library="gauge"
data-title="All Others"
data-units="requests/s"
data-gauge-adjust="width"
data-width="120"
data-before="0"
data-after="-60"
data-points="60"
data-common-max="response_statuses"
data-colors="#fe7d37"
data-decimal-digits="0"
></div>
</div>
<br/>
<div
data-netdata="web_log_nginx_netdata.response_statuses"
data-host="https://toronto.my-netdata.io"
data-dygraph-theme="sparkline"
data-width="300"
data-height="20"
data-before="0"
data-after="-60"
data-points="60"
data-common-max="1m_requests_sparkline"
></div>]]></ac:plain-text-body>
</ac:structured-macro>
<p class="auto-cursor-target">
<br/>
</p>
</div>
</td>
</tr>
</tbody>
</table>
<p class="auto-cursor-target">
<br/>
</p>
<p>
<br/>
</p>
<ac:structured-macro ac:macro-id="10bbb1a6-cd65-4a27-9b3a-cb86a5a0ebe1" ac:name="html" ac:schema-version="1">
<ac:plain-text-body><![CDATA[<script>
// don't load bootstrap - confluence does not need this
var netdataNoBootstrap = true;
// select the web notifications to show on this dashboard
// var netdataShowAlarms = true;
// var netdataAlarmsRecipients = [ 'sysadmin', 'webmaster' ];
</script>
<script src="https://london.my-netdata.io/dashboard.js"></script>
<script>
// do not hide dimensions with just zeros
NETDATA.options.current.eliminate_zero_dimensions = false;
</script>]]></ac:plain-text-body>
</ac:structured-macro>
<p class="auto-cursor-target">
<br/>
</p>
<div>
<span style="color: rgb(52,52,52);font-family: "Source Code Pro" , monospace;font-size: 16.2px;white-space: pre-wrap;background-color: rgb(252,252,252);">
<br/>
</span>
</div>
<div>
<span style="color: rgb(52,52,52);font-family: "Source Code Pro" , monospace;font-size: 16.2px;white-space: pre-wrap;background-color: rgb(252,252,252);">
<br/>
</span>
</div>