GVRS Jump Start 02_Reading File Specifications - gwlucastrig/gridfour GitHub Wiki
Introduction
The previous article in this series introduced techniques for reading data from GVRS files. In this article, we will look at techniques that let us obtain descriptive information about the underlying structure of that data. Knowing information about the size of a raster, product coordinate systems, and options for processing data will allow us to make better use of the GVRS API and GVRS files.
The GVRS file-specification API
When an application creates a new GVRS file for storing data, it provides information about grid size, data types, and other options using the GvrsFileSpecification class. The first thing the GVRS API does when creating a new file is to transcribe information from that specification into its output file. That information remains in place after the application is done writing data to its output and closes the file.
Later on, when an application opens that GVRS file for reading, the first thing the API does is to extract the specification information from the file and create a new instance of the GvrsFileSpecification class.
The code snippet below opens the ETOPO1 GVRS file that was introduced in the previous article. It extracts a safe copy of the file-specification object, and uses it to print some descriptive information about the file.
File file = new File("ETOPO1_v1.0.4.gvrs");
try (GvrsFile gvrs = new GvrsFile(file, "r")) {
  GvrsFileSpecification spec = gvrs.getSpecification();

  int nRows    = spec.getRowsInGrid();
  int nColumns = spec.getColumnsInGrid();
  long nCells  = spec.getNumberOfCellsInGrid();

  String productLabel        = spec.getLabel();
  boolean compressionEnabled = spec.isDataCompressionEnabled();
  boolean checksumsEnabled   = spec.isChecksumEnabled();
  boolean gcs                = spec.isGeographicCoordinateSystemSpecified();

  System.out.format("Rows:                %10d%n", nRows);
  System.out.format("Columns:             %10d%n", nColumns);
  System.out.format("Cells in Grid:       %10d%n", nCells);
  System.out.println("");
  System.out.format("Product Label:       %s%n", productLabel);
  System.out.format("Compression Enabled: %s%n", compressionEnabled);
  System.out.format("Checksums Enabled:   %s%n", checksumsEnabled);

  // get the bounds of the real-valued (model) coordinate specification
  double x0 = spec.getX0();
  double x1 = spec.getX1();
  double y0 = spec.getY0();
  double y1 = spec.getY1();
  System.out.println("");
  if (gcs) {
    System.out.println("Geographic Coordinate System Range of Values");
    System.out.format("   latitude:   %15.6f to %15.6f%n", y0, y1);
    System.out.format("   longitude:  %15.6f to %15.6f%n", x0, x1);
  } else {
    System.out.println("Cartesian Coordinate System Range of Values");
    System.out.format("   x:  %15.6f to %15.6f%n", x0, x1);
    System.out.format("   y:  %15.6f to %15.6f%n", y0, y1);
  }
}
The results are shown below:
Rows:                     10800
Columns:                  21600
Cells in Grid:        233280000

Identification:      ETOPO1_Ice_c_gmt4.grd
Compression Enabled: true
Checksums Enabled:   false

Geographic Coordinate System Range of Values
   latitude:       -89.991667 to       89.991667
   longitude:      -179.991667 to      179.991667
What the GvrsFileSpecification tells us
Looking at the example output above, we can see most of the basic structure and organization of the ETOPO1 GVRS file:
- The dimensions of the raster are 10800 rows by 21600 columns
- The file was stored using the optional data compression
- The optional checksum computation was not applied.
- The coordinate system used for the data is based on geographic (latitude and longitude) coordinates.
An application could use this information to configure the way it accesses the raster data. A file-inspection utility with a user interface might use this information to tell the user something about the data file (no such utility exists at this time, but it's on our "wish list").
One thing that is missing from the example above is information about what kind of data is stored in the file. We obtain this information using the getElements() method:
  List<GvrsElement> elements = gvrs.getElements();
  for (GvrsElement element : elements) {
    String name              = element.getName();     //mandatory
    GvrsElementType dataType = element.getDataType(); // mandatory

    String label             = element.getLabel();         // optional
    String description       = element.getDescription();   // optional
    String unitOfMeasure     = element.getUnitOfMeasure(); // optional

    System.out.println("Element");
    System.out.println("   Name:            " + name);
    System.out.println("   Data Type:       " + dataType);
    System.out.println("   Label:           " + label);
    System.out.println("   Description:     " + description);
    System.out.println("   Unit of Measure: " + unitOfMeasure);
  }
The ETOPO1 example product has only a single data element in it. Multiple elements are allowed. Here's the content from the example.
Element
   Name:            z
   Data Type:       SHORT
   Label:           die Höhenlage
   Description:     Elevation (positive values) or depth (negative), in meters
   Unit of Measure: m
A GVRS Element contains two identifying strings: names, and labels. The content of the mandatory name field provides a unique identifier that can be used by application code to access elements in a GVRS file. In effect, the name field serves the same role as a variable name in a conventional program or Python script. And like variable names, their syntex is rigidly defined. They follow the same general rules as identifiers in mainstream programming languages. On the other hand, the label field is an arbitrary identifier intended for human use. Labels are encoded using the UTF-8, multilingual text standard and can include any character set or syntax a data architect desires. Thus they are suited for display in user interfaces or inclusion in printed reports. In the example above, I set my label to a German-language string in order to show that it could include a broader syntax than the name field. The character set for labels, and descriptions, is based on the UTF-8 encoding. Thus, I was able to specify a label with a text string using lowercase ö with a umlaut. Other users might prefer non-Western character sets.
GVRS supports three basic data types: 16-bit integers, 32-bit integers, and single-precision floating point values. The range of global elevation and ocean depths given in meters is small enough to fit comfortably into a 16-bit "short" integer.
I will be covering GVRS elements in more detail in a future article.
API components for accessing GVRS files.
Understanding read methods and get methods
The previous article in this series showed how to obtain data for individual raster cells in a GVRS file using a "read" method as shown in the code snippet below:
File file = new File("ETOPO1_v1.0.4.gvrs");
try (GvrsFile gvrs = new GvrsFile(file, "r")) {
    GvrsElement zElement = gvrs.getElement("z");
    float value = zElement.readValue(1500, 1000);
}
But the code for obtaining the GvrsFileSpecification and GvrsElement objects from an open GVRS file used a "get" method, not a "read". In the GVRS API, the names of methods give hints about what they do. Methods named "get" or "put" access state data from GvrsFile objects. Methods named "read" or "write" access data from the GVRS data cache and may, in some cases, trigger a read or write operation for the backing data file. Thus, the read and write methods are declared as potentially throwing an IOException if used incorrectly.
There's a another kind of method that we call a "map" operation. These perform coordinate transformation. We will discuss them more below.
The GvrsElement block-reading operations
In the examples we've covered so far, data was read from the source raster one value at a time. Raster-based algorithms often require access to sets of adjacent data values. In such cases, processing can be streamlined by using the block-reading operations provided by the GvrsElement classes.
The block-reading methods fetch several data values in a single operation. Thus, they reduce the overhead required by multiple calls to the readValue() method. Because they are reading data a block at a time, they allow the API to make more efficient use of the underlying data caches. They also result in a small reduction in the number of indexing computations required for data access.
The example that follows uses the GvrsElement's readBlock() method to access blocks of 900 grid cells at a time (30 rows by 30 columns). In testing, this approach reduced the average access time by a factor of about 20 percent.
Rendering numerical data using block read operations.
The code below shows an example in which we use the elevation and bathymetry data from ETOPO1 to create a color-coded image 720 pixels wide and 360 pixels high. For each pixel, we compute the average value for a block of data values 30 rows by 30 columns in size. In order to obtain a palette for mapping elevation values to color, we use a Color Palette Table (CPT) file named ETOPO1.cpt. The Color Palette Table format is supported by a number of applications. I obtained the ETOPO1.cpt file from the [Soliton cpt-city website)[http://soliton.vm.bytemark.co.uk/pub/cpt-city/]. The Gridfour software library provides a utility API for handling CPT files.
File paletteFile = new File("ETOPO1.cpt");
CptReader cptReader = new CptReader();
ColorPaletteTable cpt = cptReader.read(paletteFile);
File file = new File("ETOPO1_v1.0.4.gvrs");
try (GvrsFile gvrs = new GvrsFile(file, "r")) {
  gvrs.setTileCacheSize(GvrsCacheSize.Large);
  GvrsFileSpecification spec = gvrs.getSpecification();
  int nRows    = spec.getRowsInGrid();
  int nColumns = spec.getColumnsInGrid();
  GvrsElement zElement = gvrs.getElement("z");
  int nBlockRows = nRows / 30;
  int nBlockCols = nColumns / 30;
  int nBlocks    = nBlockRows * nBlockCols;
  int[] argb = new int[nBlocks];
  for (int iBlockRow = 0; iBlockRow < nBlockRows; iBlockRow++) {
    int pixelRow = nBlockRows - 1 - iBlockRow;
    int pixelIndex = pixelRow * nBlockCols;
    for (int iBlockCol = 0; iBlockCol < nBlockCols; iBlockCol++) {
      int iRow = iBlockRow * 30;
      int iCol = iBlockCol * 30;
      float[] block = zElement.readBlock(iRow, iCol, 30, 30);
      float sum = 0;
      for (int i = 0; i < block.length; i++) {
        sum += block[i];
      }
      float averageValue = sum / block.length;
      argb[pixelIndex++] = cpt.getArgb(averageValue);
    }
  }
}

BufferedImage bImage = new BufferedImage(nBlockCols, nBlockRows, BufferedImage.TYPE_INT_RGB);
bImage.setRGB(0, 0, nBlockCols, nBlockRows, argb, 0, nBlockCols);
ImageIO.write(bImage, "PNG", new File("ETOPO1_ds1.png"));
The resulting image is shown below.
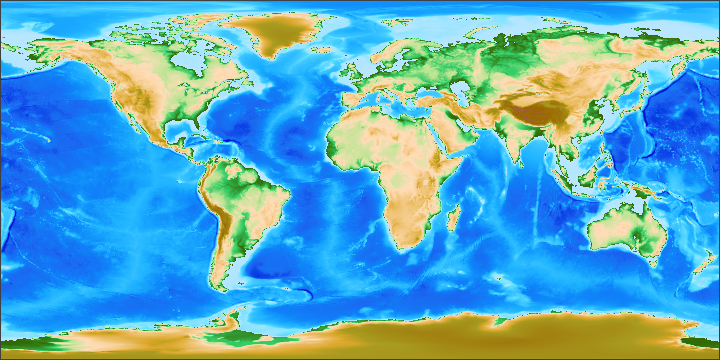
The results are disappointing. The unattractive speckles that appear in the image are an artifact of the way color is assigned to averaged values. An average is a linear combination of data values. But the mapping from a real-valued elevation to a color assignment is non-linear. For the ETOPO1.cpt palette, the change in color value is particularly abrupt at the transition from water to land. In the logic above, a pixel taken near the coast combines 900 data values. Some of them represent depth samples. Some represent land. But the overall average can be only one or the other. The change in pixel color from shades of green to shades of bluish white is instantaneous.
Improving the rendering
To improve the appearance of the image, we need to blend colors in a more gradual manner. So we do not map the overall average of the elevations to a color. Instead, we compute individual colors for each of the 900 sample elevations and perform an average on the resulting set of colors rather than on the set of elevations. That treatment, which is shown in the code below, produces a blended color value for each pixel.
float[] block = zElement.readBlock(iRow, iCol, 30, 30);
int rSum = 0;
int gSum = 0;
int bSum = 0;
for (int i = 0; i < block.length; i++) {
    int rgb = cpt.getArgb(block[i]);
    rSum += (rgb >> 16) & 0xff;
    gSum += (rgb >> 8) & 0xff;
    bSum += rgb & 0xff;
}
int r = (int) ((double) rSum / (double) block.length + 0.5);
int g = (int) ((double) gSum / (double) block.length + 0.5);
int b = (int) ((double) bSum / (double) block.length + 0.5);
argb[pixelIndex++] = 0xff000000 | (r << 16) | (g << 8) | b;
Averaging color values rather than elevations, eliminates speckles and softens the sawtooth effect near the shore. The resulting image is shown below.
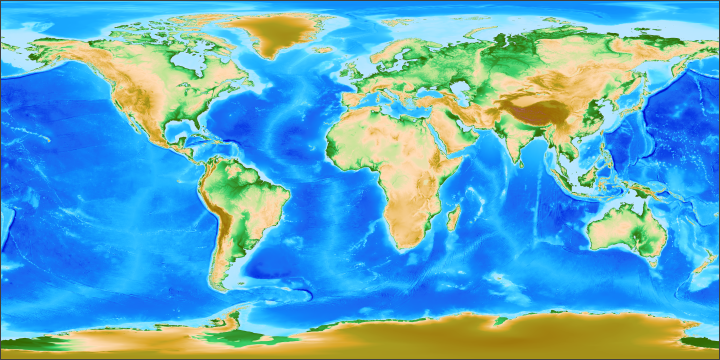
Although the overall appearance of the image is better, it is not completely satisfactory. Most of us are accustomed to seeing Greenland, Antarctica, and the high Himalayas depicted in shades of white and light gray to reflect the fact that they are permanently covered with ice. Further improvements to the depiction depend on additional data sources. Techniques for integrating additional data sources into a GVRS-based depiction will be the topic of a future article.
GVRS coordinate systems
The previous article in this series discussed ways to perform look-up operations for named locations (Coachella, La Paz, Pontypridd, etc.) that were defined by latitude and longitude. The key to doing so was matching the geographic coordinates for the points-of-interest to row and column index values in the underlaying raster. In other words, the data query depended on the idea of transforming coordinates from one system into another. Understanding how the GVRS API defines coordinate systems is essential to being able to perform successful data queries from GVRS products.
At the present time, GVRS defines three separate coordinate systems:
- Grid coordinates – Grid cell indices, always given in the order row, column.
- Model coordinates – Real-valued coodinates given in the coordinate system used by the source data. At this time, GVRS supports Cartesian coordinates for this purpose, though future implementations may include alternate systems (polar coordinates, etc.). The term "model" is borrowed from its use in the well-known TIFF image format.
- Geographic coordinates – Real-valued coordinates given in degrees, aways given in the order latitude, longitude.
What we mean by "mappings"
The GVRS API uses the term "map" for naming methods that transform coordinates from one system to another. The verb "map" is borrowed from mathematics, where it is often used as a synonym for a function (see Wikipedia, "Map (mathematics)"). Here's an example of one pair of mapping methods:
GridPoint gridPoint = spec.mapGeographicToGridPoint(latitude, longitude);
GeoPoint  geoPoint  = spec.mapGridToGeoPoint(gridPoint.getRow(), gridPoint.getColumn());
Even though grid cells are accessed by integral row and column indices, the row and column values stored in the GridPoint instance use real-valued coordinates to support interpolation or similar operations. The GridPoint has variations for obtaining either real or integer values.
GridPoint gridPoint = spec.mapGeographicToGridPoint(latitude, longitude);
double row     = gridPoint.getRow();
double column  = gridPoint.getColumn();
int    iRow    = gridPoint.getRowInt();      // (int)(row+0.5)
int    iColumn = gridPoint.getColumnInt();   // (int)(column+0.5)
Geographic coordinates and datums
Datums are a specialized topic in cartography. Because it is so critical to GIS applications, I will address it here briefly. At this time, the Gridfour project has not integrated any explicit support for datums in our geographic coordinate implementation. The GVRS API leaves it to the application developer to ensure that all geographic coordinates passed to the code are in a consistent datum. For GIS specialists, GVRS does support the specification of Well-Known-Text (WKT) as part of a file specification. In fact, the ETOPO1_v1.0.4.gvrs file includes a WKT metadata block.
Conclusion
Having covered the techniques used for reading a GVRS raster data store, we are now ready to move on to the topic of writing data. In the next article, we will use some of concepts introduced in this article to see how to create a new GVRS file and use it for the storage and processing of data.