Monitoring - guydavis/machinaris GitHub Wiki
Advanced dashboard monitoring of the blockchain status (farming and harvesting only) can be accomplished with either Farmr or Grafana. Both are optional add-ons which enhance and complement the basic monitoring and alerting provided for farming, harvesting, and plotting by Machinaris itself.
Chia-Exporter
Set an environment variable of chia_exporter=true in the Docker launch of Machinaris fullnode to enable chia-exporter and expose port 9914 if you want metrics available for reporting in Prometheus.
Farmr
DEPRECATED: As of 2023, it seems the author of Farmr is no longer maintaining it. As such, I don't recommend using this old tool for monitoring.
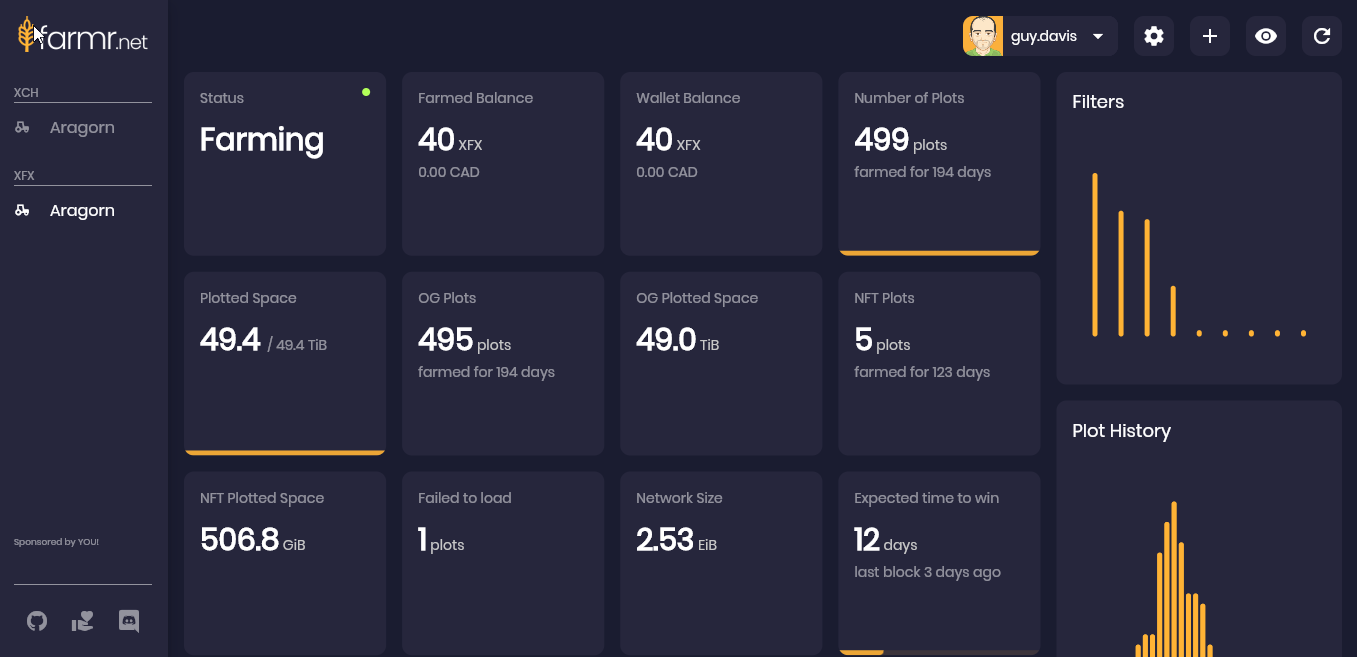
Farmr is a web dashboard that allows you to monitor your farm (Chia & forks) and sends notifications when blocks are found and new plots are completed through a discord bot. It can link multiple farmers/harvesters to your account. Farmr is an optional add-on to Machinaris, not enabled by default.
NOTE: Farmr is an external service, not affiliated with the Machinaris project. Unlike Machinaris, Farmr is hosted on the public Internet, therefore your farm's status will be stored outside your network. To ENABLE farmr, pass environment variable farmr_skip_launch with value of false in the docker-compose.yml when launching Machinaris, for each fullnode and harvester container.
Initialization
Each Machinaris container (farmer/harvester) contains the farmr binary which sends monitoring reports from your network to the Farmr.net endpoints on the public Internet. This occurs only when you register each Machinaris container with the Farmr.net dashboard using the unique Farmr device ID.
This ID can be viewed in the Machinaris WebUI on the Workers page. Select the Worker by row, and click into it for details.
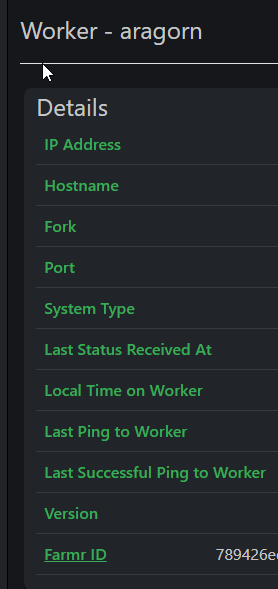
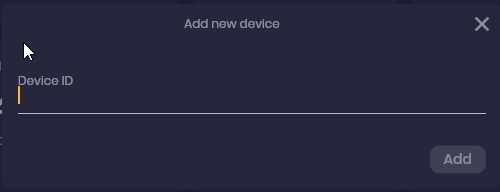
Then copy this Farmr ID value, including the fork currency symbol on the end, into the 'Add Device' (plus button in top-right) of the Farmr.net dashboard. Look for a message of 'Linked ID with success' in the bottom-left to indicate the Machinaris container will now submit monitoring reports.
NOTE: Due to the way the farmr binary terminates itself until the Device ID is linked to an account on Farmr.net, you need to restart the Machinaris container to get farmr submitting reports consistently and to appear in the dashboard. Please be patient before submitting defects related to Farmr.net.
Configuration
The first thing to do once you see the generic 'Farmer' or 'Harvester' appear in the Farmr dashboard after initialization by a Machinaris worker above is to configure it. With the generic name selected along the left-side of the Farmr dashboard, click the Setup icon in the top-right to view the Settings dialog:
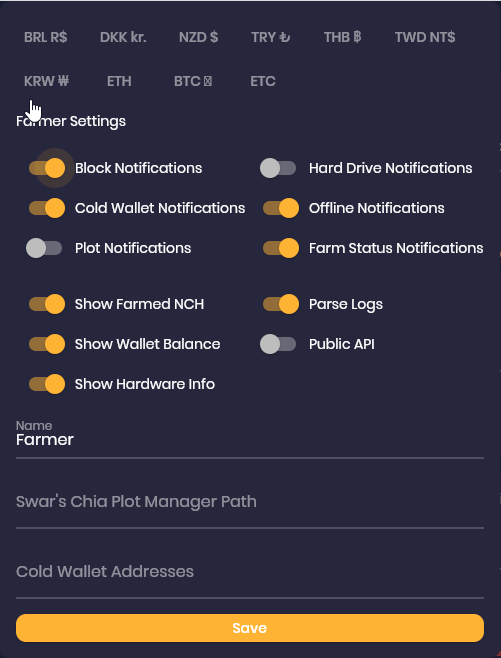
Some recommended configuration updates:
- Change the generic 'Farmer' or 'Harvester' name to hostname of your Machinaris worker.
- If this is a Chia or Chives worker, then enable 'Plot Notifications' and 'Drive Notifications'. Don't turn these on very each fork container as you will likely get duplicated alerts.
- Choose your preferred currency conversion. Then don't forget to hit the Save button!
Grafana
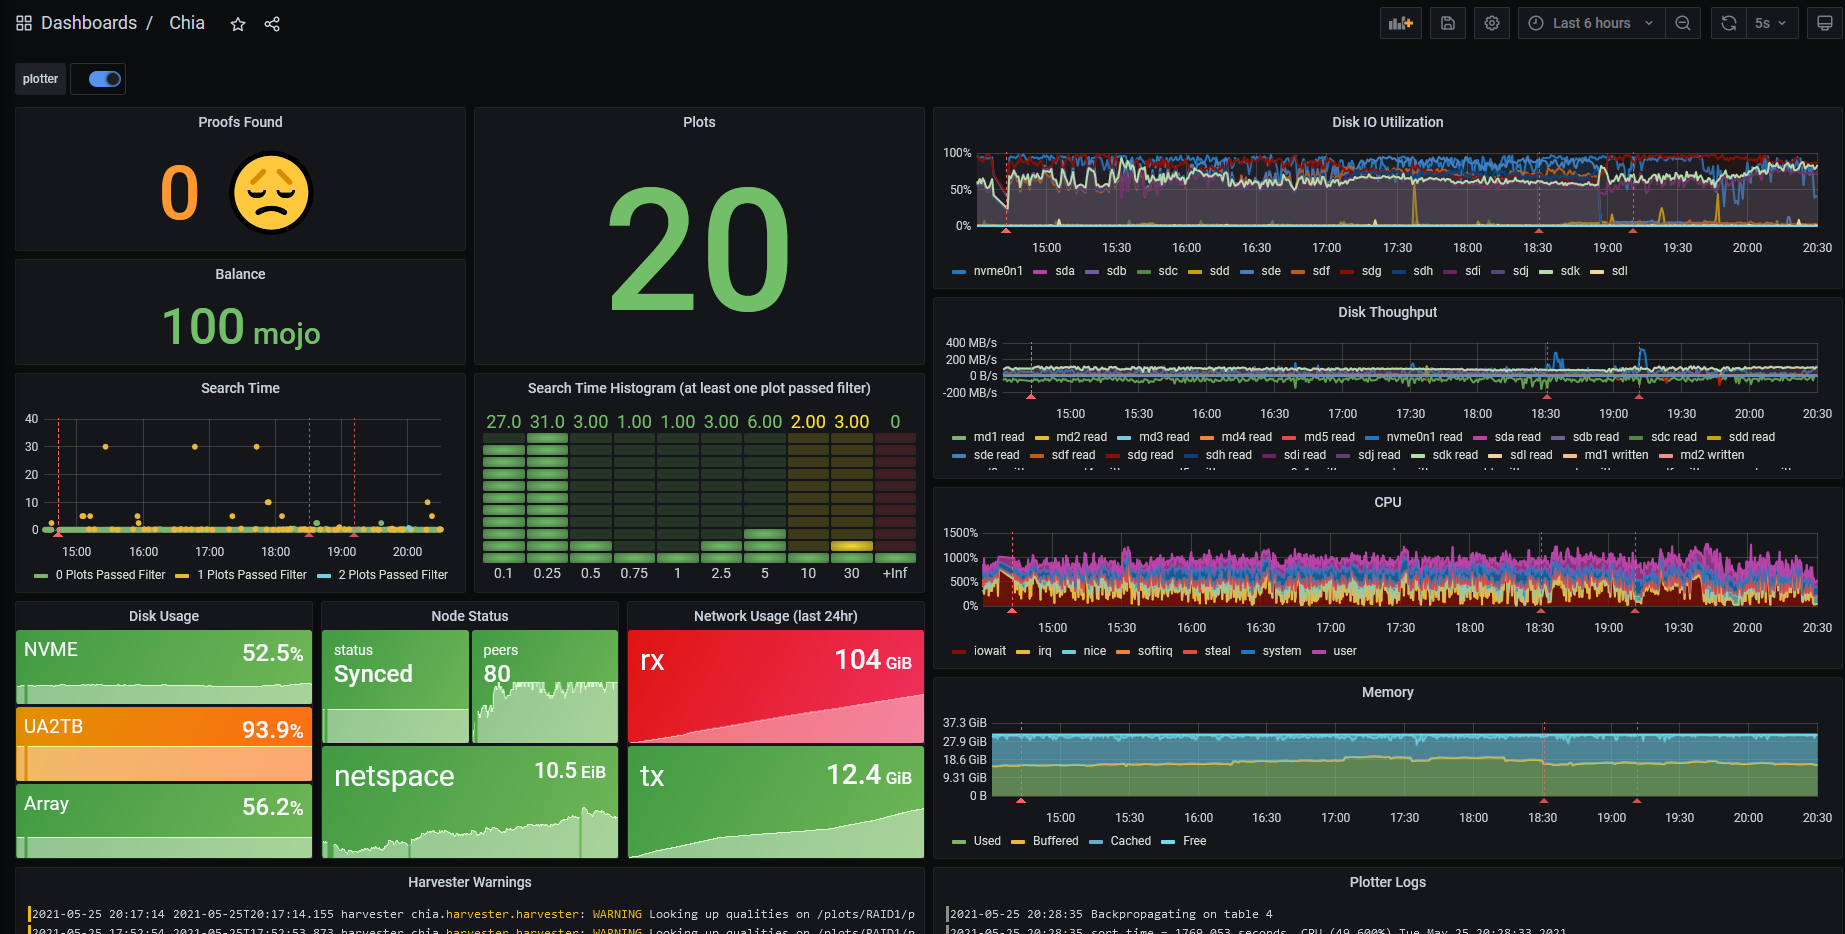
The Grafana dashboard platform can be used to build beautiful reporting of your Chia farming and plotting. Here are some great pre-built dashboards to try.
Chia-Monitor

Chia-Monitor requires you run an external Grafana and Prometheus service.
NOTE: Integration with Machinaris needs help! Please contribute your experience using them together.
ChiaMon
Note: This was a user-contributed solution provided in May 2021. It has not be validated with more recent versions of Machinaris.
Unraid
Prerequisites:
- in a normal Unraid Setup the appdata is located in
/mnt/user/appdata - Setup Machinaris from the 'Community Applications' Page
- check that
gitis installed (verify withgit --version) docker-composeinstalled (Getdocker-composeon Unraid)
in your unraid terminal (not in the machinaris container) cd into appdata
cd /mnt/user/appdata
then clone the repository from chiamon
git clone https://github.com/retzkek/chiamon
then go into the chiamon directory
cd chiamon
then edit the docker-compose.yml to fit your settings
vi docker-compose.yml / nano docker-compose-yml
example:
services:
  mtail:
    build: mtail
    command:
      - "-progs"
      - "/etc/mtail"
      - "-logs"
      - "/var/log/chia/debug.log"
      - "-logtostderr"
    volumes:
      - /mnt/user/appdata/machinaris/mainnet/log/:/var/log/chia/
    network_mode: host
  node_exporter:
    image: quay.io/prometheus/node-exporter:latest
    command:
      - '--path.rootfs=/host'
    pid: host
    volumes:
      - '/:/host:ro'
    network_mode: host
  chia_exporter:
    build: chia_exporter
    command:
      - "-cert"
      - "/etc/chia.crt"
      - "-key"
      - "/etc/chia.key"
    volumes:
      - /mnt/user/appdata/machinaris/mainnet/config/ssl/full_node/private_full_node.crt:/etc/chia.crt
      - /mnt/user/appdata/machinaris/mainnet/config/ssl/full_node/private_full_node.key:/etc/chia.key
    network_mode: host
  prometheus:
    build: prometheus
    volumes:
      - prom_data:/prometheus
    network_mode: host
  loki:
    image: grafana/loki:2.0.0
    command: -config.file=/etc/loki/local-config.yaml
    network_mode: host
  promtail:
    build: promtail
    volumes:
      - /mnt/user/appdata/machinaris/mainnet/log:/var/log/chia
      - /mnt/user/appdata/machinaris/plotman/logs:/var/log/plotter
    command: -config.file=/etc/promtail/config.yml
    network_mode: host
  grafana:
    build: grafana
    network_mode: host
volumes:
  prom_data:
--> just edit line 20 from the node_exporter section to - '/:/host:ro'
here with the original docker-compose.yaml (- '/:/host:ro,rslave') it will throw a error
then compile the containers with
docker-compose up -d
if everything is working you can go to http://IP_OF_YOUR_SERVER:3000 to visit Grafana