Lab 8 - gracie-miller/BAE305-S19 GitHub Wiki
Lab 8 - Transistors and Transistor Switches
By: Gracie Miller and Rachel Rohrer
Summary
The purpose of this lab was to become familiar with using transistors and transistor switches in circuits and understanding how they effect the circuits they're a part of. A series of different circuits were built to help with this objective. Additionally, a new Arduino concept was incorporated into the lab in which a counter was used to continuously count up and down.
Materials
- JAMECO Breadboard JE27
- TIP 31C transistor
- 270 Ohm, 1K Ohm, and 2.2 Ohms resistors
- Fan
- LED
- Switch button
- 1K Ohm Potentiometer
- Arduino
- wires
- Global Specialties 1301A Power Supply
Assembly Procedures
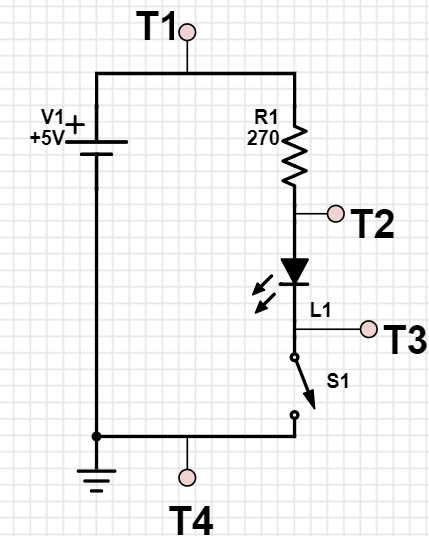
Build Circuit 1 following the schematic below:
Build Circuit 2 following the schematic below:

Build Circuit 3 following the schematic below:

Build Circuit 4 following the schematic below:

Build Circuit 5 following the schematic below:

Circuit 6: For Circuit 6, disconnect the potentiometer from Circuit 5. The potentiometer will be replaced by the Arduino with a PWM capable pin from the Arduino in Test position 6. After assembling the Circuit 6, write the code as seen below so that the fan is off for 10 seconds, ramps up for 30 seconds, runs at full speed for 10 seconds, and ramps down for 30 seconds before the process repeats.
void setup() {
  // put your setup code here, to run once:
Serial.begin (9600);
pinMode(7, OUTPUT);
}

void loop() {
 delay (1000); // put your main code here, to run repeatedly:
for (int i=0; i<=100; i++)
{
  Serial.println (i);
 analogWrite (7, i+130);
  delay(250);
}
delay (1000);
for (int i= 100; i>=0; i--)
{Serial.println(i);
analogWrite (7, i+120);
delay (250);
}
analogWrite(7,0);
}
Test Equipment
- Fluke 87 True RMS Multimeter
- MY 69 Multimeter
- Precision 815
- Arduino IDE
Test Procedures
Before building any circuits, measure the actual resistance of each resistor using the Fluke and record the values.
Circuit 1
Measure the voltage from each of the designated test points (indicated as T# in the above schematic) when the switch is on and when the switch is off. Then measure the voltage across R1, the LED, and the switch. Do this twice, once each for when the switch is on and off. Using Ohm's law, calculate the current through the LED in both cases.
Circuit 2
Measure the voltage from each of the designated test points (indicated as T# in the above schematic) when the switch is on and when the switch is off. Then measure the voltage across R1, the LED, R2, and the switch. Do this twice, once each for when the switch is on and off. Using Ohm's law, calculate the current through the LED and R2 for both cases.
Circuit 3
Measure the voltage from each of the designated test points (indicated as T# in the above schematic) when the LED is just barely glowing. Then measure the voltage across R1, R2, and the LED. Using Ohm's law, calculate the current through the LED and R2. Calculate the gain by dividing the current through the LED by the current through R2. Repeat this process after increasing the brightness of the LED by adjusting the potentiometer slightly. This process is to be repeated 5 times. One of the repeats should be when the LED is just at its brightest and the other four should be midpoints between this brightest setting and when the LED is just barely glowing.
Circuit 4
Measure the voltage from each of the designated test points (indicated as T# in the above schematic) when the switch is on and when the switch is off. Then measure the voltage across R1, R2, the motor, and the switch. Do this twice, once each for when the switch is on and off. Using Ohm's law, calculate the current through the motor and R2 for when the switch is on and when the switch is off.
Circuit 5
Measure the voltage from each of the designated test points (indicated as T# in the above schematic) when the fan is just barely turning. Then measure the voltage across R1, R2, and the motor. Using Ohm's law, calculate the current through the motor and R2. Calculate the gain by dividing the current through the motor by the current through R2. Repeat this process after increasing the speed of the fan by adjusting the potentiometer slightly. This process is to be repeated 5 times. One of the repeats should be when the fan is just at its fastest and the other four should be midpoints between this fastest setting and when the fan is just barely turning.
Circuit 6
Circuit 6 required minimal testing that just involved experimenting with the code in order to get the ramp up and ramp down timing correct.
Test Results
Resistor Values:

Circuit 1:

Circuit 2:

Circuit 3:

Circuit 4:

Circuit 5:

Discussion
Regarding Circuit 2
How does the current through the button compare between circuits 1 and 2?
The current through the button was not calculated in either of these circuits.
What is the voltage drop (VCE) across the transistor (Q1) when the LED is on? In this state, the transistor should be operating in the saturation region. The datasheet mentions a maximum voltage drop (VCE) of 1.2V. We would actually like a much smaller value, such as the fraction of a volt that you measure across the switch, S1, when it is pressed. How does your measured VCE compare to the ideal or the maximum listed in the datasheet?
VCE = 0.016 when the switch is on. This is much lower than the maximum of 1.2V and is much closer the the voltage across the switch when it is pressed. The measured voltage across the transistor is 75 times smaller than the maximum voltage drop. When the switch is off, VCE= 3.54V. This is much larger than the 1.2V maximum.
Regarding Circuit 3
In your lab report, create a table and a graph showing IB, IC, Gain, and VCE for the various input voltages. We need this for both the LED and the motor.

Regarding Circuit 4
What is the voltage drop (VCE) across the transistor (Q1) when the motor is on? How does this compare with the circuit that switched the LED?
When the motor is on, VCE= 0.07V. This is 4.375 times larger than the VCE for the circuit with the LED. This may be because the motor requires more voltage to function than the LED does.
How much current is going through the motor? How does this compare to the current that the LED circuit used? If the switch was only just barely able to meet the current requirements of the LED, could it support the motor directly or would the transistor switch be required?
There were 4.77 amps going through the motor. There were only 2.04 Amps going through the LED. If the switch was only just barely able to meet the current requirements of the LED, it could not support the motor without the transistor because there was more than twice the current going through the motor than the LED.
Regarding Circuit 5
In your lab report, create a table and a graph showing IB, IC, Gain, and VCE for the various input voltages.

Regarding the Entire Lab
How does the gain and saturation voltage vary between the circuit configurations?
The only circuits we measured gain in were Circuits 3 and 5. At their lowest settings, the gain was 65.59 in Circuit 3 and 87.55 in Circuit 5. At their highest settings, the gain was 35.77 in Circuit 3 and 111.97 in Circuit 5. Increase in intensity lowered the gain for Circuit 3 but raised it for Circuit 5. The parallel component in Circuit 5 may be why the gain increased instead of decreasing like in Circuit 3.
For both the LED in Circuit 3 and the fan in Circuit 5, the saturation voltage was achieved at lower intensities; lower intensity being a dimmer LED for Circuit 3 and a slower spinning fan for Circuit 5. As seen in both graphs above, the gain holds steady until the intensity of either the LED or Fan reaches a maximum, at which point the gain drops. In the graph for Circuit 3, the gain remains stable around 90 as VCE increases until the LED approaches its brightest output. As the circuit approaches this point, the gain drops. In the graph for Circuit 5, the gain remains stable around 115 as VCE decreases until the fan approaches its fastest speed. As the circuit approaches this point, the gain drops.