Example plots - gonum/plot GitHub Wiki
Lines and Points
Plotutil
If the default style (color, dashes, and glyph shapes) work for you then the plotutil package makes creating line and points plots very easy:

package main

import (
	"math/rand"

	"gonum.org/v1/plot"
	"gonum.org/v1/plot/plotter"
	"gonum.org/v1/plot/plotutil"
	"gonum.org/v1/plot/vg"
)

func main() {
	rand.Seed(int64(0))

	p := plot.New()

	p.Title.Text = "Plotutil example"
	p.X.Label.Text = "X"
	p.Y.Label.Text = "Y"

	err := plotutil.AddLinePoints(p,
		"First", randomPoints(15),
		"Second", randomPoints(15),
		"Third", randomPoints(15))
	if err != nil {
		panic(err)
	}

	// Save the plot to a PNG file.
	if err := p.Save(4*vg.Inch, 4*vg.Inch, "points.png"); err != nil {
		panic(err)
	}
}

// randomPoints returns some random x, y points.
func randomPoints(n int) plotter.XYs {
	pts := make(plotter.XYs, n)
	for i := range pts {
		if i == 0 {
			pts[i].X = rand.Float64()
		} else {
			pts[i].X = pts[i-1].X + rand.Float64()
		}
		pts[i].Y = pts[i].X + 10*rand.Float64()
	}
	return pts
}
More Detailed Style Settings
If you need more fine-grained control it is available too:

package main

import (
	"image/color"
	"math/rand"

	"gonum.org/v1/plot"
	"gonum.org/v1/plot/plotter"
	"gonum.org/v1/plot/vg"
	"gonum.org/v1/plot/vg/draw"
)

func main() {
	// Get some random points
	rand.Seed(int64(0))
	n := 15
	scatterData := randomPoints(n)
	lineData := randomPoints(n)
	linePointsData := randomPoints(n)

	// Create a new plot, set its title and
	// axis labels.
	p := plot.New()

	p.Title.Text = "Points Example"
	p.X.Label.Text = "X"
	p.Y.Label.Text = "Y"
	// Draw a grid behind the data
	p.Add(plotter.NewGrid())

	// Make a scatter plotter and set its style.
	s, err := plotter.NewScatter(scatterData)
	if err != nil {
		panic(err)
	}
	s.GlyphStyle.Color = color.RGBA{R: 255, B: 128, A: 255}

	// Make a line plotter and set its style.
	l, err := plotter.NewLine(lineData)
	if err != nil {
		panic(err)
	}
	l.LineStyle.Width = vg.Points(1)
	l.LineStyle.Dashes = []vg.Length{vg.Points(5), vg.Points(5)}
	l.LineStyle.Color = color.RGBA{B: 255, A: 255}

	// Make a line plotter with points and set its style.
	lpLine, lpPoints, err := plotter.NewLinePoints(linePointsData)
	if err != nil {
		panic(err)
	}
	lpLine.Color = color.RGBA{G: 255, A: 255}
	lpPoints.Shape = draw.PyramidGlyph{}
	lpPoints.Color = color.RGBA{R: 255, A: 255}

	// Add the plotters to the plot, with a legend
	// entry for each
	p.Add(s, l, lpLine, lpPoints)
	p.Legend.Add("scatter", s)
	p.Legend.Add("line", l)
	p.Legend.Add("line points", lpLine, lpPoints)

	// Save the plot to a PNG file.
	if err := p.Save(4*vg.Inch, 4*vg.Inch, "points.png"); err != nil {
		panic(err)
	}
}

// randomPoints returns some random x, y points.
func randomPoints(n int) plotter.XYs {
	pts := make(plotter.XYs, n)
	for i := range pts {
		if i == 0 {
			pts[i].X = rand.Float64()
		} else {
			pts[i].X = pts[i-1].X + rand.Float64()
		}
		pts[i].Y = pts[i].X + 10*rand.Float64()
	}
	return pts
}
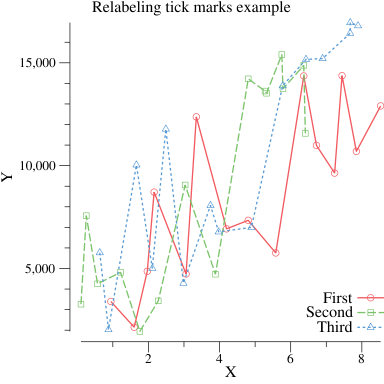
Custom tick marks
You can override the Axis.Tick.Marker function to make your own custom tick marks. Some people like commas separating the place values of numbers:
package main

import (
	"math/rand"

	"gonum.org/v1/plot"
	"gonum.org/v1/plot/plotter"
	"gonum.org/v1/plot/plotutil"
	"gonum.org/v1/plot/vg"
)

func main() {
	rand.Seed(int64(0))

	p := plot.New()

	p.Title.Text = "Relabeling tick marks example"
	p.X.Label.Text = "X"
	p.Y.Label.Text = "Y"
	// Use a custom tick marker interface implementation with the Ticks function,
	// that computes the default tick marks and re-labels the major ticks with commas.
	p.Y.Tick.Marker = commaTicks{}

	err := plotutil.AddLinePoints(p,
		"First", randomPoints(15),
		"Second", randomPoints(15),
		"Third", randomPoints(15))
	if err != nil {
		panic(err)
	}

	// Save the plot to a PNG file.
	if err := p.Save(4*vg.Inch, 4*vg.Inch, "points_commas.png"); err != nil {
		panic(err)
	}
}

// RandomPoints returns some random x, y points.
func randomPoints(n int) plotter.XYs {
	pts := make(plotter.XYs, n)
	for i := range pts {
		if i == 0 {
			pts[i].X = rand.Float64()
		} else {
			pts[i].X = pts[i-1].X + rand.Float64()
		}
		pts[i].Y = (pts[i].X + 10*rand.Float64()) * 1000
	}
	return pts
}

type commaTicks struct{}
// Ticks computes the default tick marks, but inserts commas
// into the labels for the major tick marks.
func (commaTicks) Ticks(min, max float64) []plot.Tick {
	tks := plot.DefaultTicks{}.Ticks(min, max)
	for i, t := range tks {
		if t.Label == "" { // Skip minor ticks, they are fine.
			continue
		}
		tks[i].Label = addCommas(t.Label)
	}
	return tks
}

// AddCommas adds commas after every 3 characters from right to left.
// NOTE: This function is a quick hack, it doesn't work with decimal
// points, and may have a bunch of other problems.
func addCommas(s string) string {
	rev := ""
	n := 0
	for i := len(s) - 1; i >= 0; i-- {
		rev += string(s[i])
		n++
		if n%3 == 0 {
			rev += ","
		}
	}
	s = ""
	for i := len(rev) - 1; i >= 0; i-- {
		s += string(rev[i])
	}
	return s
}
Points with error bars

package main

import (
	"math/rand"

	"gonum.org/v1/plot"
	"gonum.org/v1/plot/plotter"
	"gonum.org/v1/plot/plotutil"
)

func main() {
	// Get some data.
	n, m := 5, 10
	pts := make([]plotter.XYer, n)
	for i := range pts {
		xys := make(plotter.XYs, m)
		pts[i] = xys
		center := float64(i)
		for j := range xys {
			xys[j].X = center + (rand.Float64() - 0.5)
			xys[j].Y = center + (rand.Float64() - 0.5)
		}
	}

	plt, err := plot.New()
	if err != nil {
		panic(err)
	}

	// Create two lines connecting points and error bars. For
	// the first, each point is the mean x and y value and the
	// error bars give the 95% confidence intervals.  For the
	// second, each point is the median x and y value with the
	// error bars showing the minimum and maximum values.
	mean95, err := plotutil.NewErrorPoints(plotutil.MeanAndConf95, pts...)
	if err != nil {
		panic(err)
	}
	medMinMax, err := plotutil.NewErrorPoints(plotutil.MedianAndMinMax, pts...)
	if err != nil {
		panic(err)
	}
	plotutil.AddLinePoints(plt,
		"mean and 95% confidence", mean95,
		"median and minimum and maximum", medMinMax)
	plotutil.AddErrorBars(plt, mean95, medMinMax)

	// Add the points that are summarized by the error points.
	plotutil.AddScatters(plt, pts[0], pts[1], pts[2], pts[3], pts[4])

	plt.Save(4*vg.Inch, 4*vg.Inch, "errpoints.png")
}
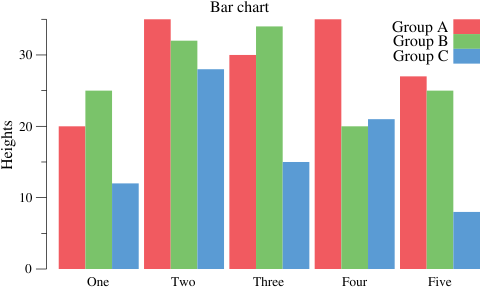
Bar Charts
package main

import (
	"gonum.org/v1/plot"
	"gonum.org/v1/plot/plotter"
	"gonum.org/v1/plot/plotutil"
	"gonum.org/v1/plot/vg"
)

func main() {
	groupA := plotter.Values{20, 35, 30, 35, 27}
	groupB := plotter.Values{25, 32, 34, 20, 25}
	groupC := plotter.Values{12, 28, 15, 21, 8}

	p := plot.New()

	p.Title.Text = "Bar chart"
	p.Y.Label.Text = "Heights"

	w := vg.Points(20)

	barsA, err := plotter.NewBarChart(groupA, w)
	if err != nil {
		panic(err)
	}
	barsA.LineStyle.Width = vg.Length(0)
	barsA.Color = plotutil.Color(0)
	barsA.Offset = -w

	barsB, err := plotter.NewBarChart(groupB, w)
	if err != nil {
		panic(err)
	}
	barsB.LineStyle.Width = vg.Length(0)
	barsB.Color = plotutil.Color(1)

	barsC, err := plotter.NewBarChart(groupC, w)
	if err != nil {
		panic(err)
	}
	barsC.LineStyle.Width = vg.Length(0)
	barsC.Color = plotutil.Color(2)
	barsC.Offset = w

	p.Add(barsA, barsB, barsC)
	p.Legend.Add("Group A", barsA)
	p.Legend.Add("Group B", barsB)
	p.Legend.Add("Group C", barsC)
	p.Legend.Top = true
	p.NominalX("One", "Two", "Three", "Four", "Five")

	if err := p.Save(5*vg.Inch, 3*vg.Inch, "barchart.png"); err != nil {
		panic(err)
	}
}
Functions

package main

import (
	"image/color"
	"math"

	"gonum.org/v1/plot"
	"gonum.org/v1/plot/plotter"
	"gonum.org/v1/plot/vg"
)

func main() {
	p := plot.New()

	p.Title.Text = "Functions"
	p.X.Label.Text = "X"
	p.Y.Label.Text = "Y"

	// A quadratic function x^2
	quad := plotter.NewFunction(func(x float64) float64 { return x * x })
	quad.Color = color.RGBA{B: 255, A: 255}

	// An exponential function 2^x
	exp := plotter.NewFunction(func(x float64) float64 { return math.Pow(2, x) })
	exp.Dashes = []vg.Length{vg.Points(2), vg.Points(2)}
	exp.Width = vg.Points(2)
	exp.Color = color.RGBA{G: 255, A: 255}

	// The sine function, shifted and scaled
	// to be nicely visible on the plot.
	sin := plotter.NewFunction(func(x float64) float64 { return 10*math.Sin(x) + 50 })
	sin.Dashes = []vg.Length{vg.Points(4), vg.Points(5)}
	sin.Width = vg.Points(4)
	sin.Color = color.RGBA{R: 255, A: 255}

	// Add the functions and their legend entries.
	p.Add(quad, exp, sin)
	p.Legend.Add("x^2", quad)
	p.Legend.Add("2^x", exp)
	p.Legend.Add("10*sin(x)+50", sin)
	p.Legend.ThumbnailWidth = 0.5 * vg.Inch

	// Set the axis ranges.  Unlike other data sets,
	// functions don't set the axis ranges automatically
	// since functions don't necessarily have a
	// finite range of x and y values.
	p.X.Min = 0
	p.X.Max = 10
	p.Y.Min = 0
	p.Y.Max = 100

	// Save the plot to a PNG file.
	if err := p.Save(4*vg.Inch, 4*vg.Inch, "functions.png"); err != nil {
		panic(err)
	}
}
Histograms

package main

import (
	"image/color"
	"math"
	"math/rand"

	"gonum.org/v1/plot"
	"gonum.org/v1/plot/plotter"
	"gonum.org/v1/plot/vg"
	"github.com/gonum/stat/distuv"
)

func main() {
	// Draw some random values from the standard
	// normal distribution.
	rand.Seed(int64(0))
	v := make(plotter.Values, 10000)
	for i := range v {
		v[i] = rand.NormFloat64()
	}

	// Make a plot and set its title.
	p := plot.New()

	p.Title.Text = "Histogram"

	// Create a histogram of our values drawn
	// from the standard normal.
	h, err := plotter.NewHist(v, 16)
	if err != nil {
		panic(err)
	}
	// Normalize the area under the histogram to
	// sum to one.
	h.Normalize(1)
	p.Add(h)

	// The normal distribution function
	norm := plotter.NewFunction(distuv.UnitNormal.Prob)
	norm.Color = color.RGBA{R: 255, A: 255}
	norm.Width = vg.Points(2)
	p.Add(norm)

	// Save the plot to a PNG file.
	if err := p.Save(4*vg.Inch, 4*vg.Inch, "hist.png"); err != nil {
		panic(err)
	}
}
Box Plots
Vertical

package main

import (
	"math/rand"

	"gonum.org/v1/plot"
	"gonum.org/v1/plot/plotter"
	"gonum.org/v1/plot/vg"
)

func main() {
	// Get some data to display in our plot.
	rand.Seed(uint64(0))
	n := 10
	uniform := make(plotter.Values, n)
	normal := make(plotter.Values, n)
	expon := make(plotter.Values, n)
	for i := 0; i < n; i++ {
		uniform[i] = rand.Float64()
		normal[i] = rand.NormFloat64()
		expon[i] = rand.ExpFloat64()
	}

	// Create the plot and set its title and axis label.
	p := plot.New()

	p.Title.Text = "Box plots"
	p.Y.Label.Text = "Values"

	// Make boxes for our data and add them to the plot.
	w := vg.Points(20)
	b0, err := plotter.NewBoxPlot(w, 0, uniform)
        b0.FillColor = color.RGBA{127, 188, 165, 1}
	if err != nil {
		panic(err)
	}
	b1, err := plotter.NewBoxPlot(w, 1, normal)
        b1.FillColor = color.RGBA{127, 188, 165, 1}
	if err != nil {
		panic(err)
	}
	b2, err := plotter.NewBoxPlot(w, 2, expon)
        b2.FillColor = color.RGBA{127, 188, 165, 1}
	if err != nil {
		panic(err)
	}
	p.Add(b0, b1, b2)

	// Set the X axis of the plot to nominal with
	// the given names for x=0, x=1 and x=2.
	p.NominalX("Uniform\nDistribution", "Normal\nDistribution",
		"Exponential\nDistribution")

	if err := p.Save(3*vg.Inch, 4*vg.Inch, "boxplot.png"); err != nil {
		panic(err)
	}
}
Or, the same plot using the plotutil package:
package main

import (
	"math/rand"

	"gonum.org/v1/plot"
	"gonum.org/v1/plot/plotter"
	"gonum.org/v1/plot/plotutil"
	"gonum.org/v1/plot/vg"
)

func main() {
	// Get some data to display in our plot.
	rand.Seed(int64(0))
	n := 10
	uniform := make(plotter.Values, n)
	normal := make(plotter.Values, n)
	expon := make(plotter.Values, n)
	for i := 0; i < n; i++ {
		uniform[i] = rand.Float64()
		normal[i] = rand.NormFloat64()
		expon[i] = rand.ExpFloat64()
	}

	// Create the plot and set its title and axis label.
	p := plot.New()

	p.Title.Text = "Box plots"
	p.Y.Label.Text = "Values"

	// Make boxes for our data and add them to the plot.
	err := plotutil.AddBoxPlots(p, vg.Points(20),
		"Uniform\nDistribution", uniform,
		"Normal\nDistribution", normal,
		"Exponential\nDistribution", expon)
	if err != nil {
		panic(err)
	}

	if err := p.Save(3*vg.Inch, 4*vg.Inch, "boxplot.png"); err != nil {
		panic(err)
	}
}
Horizontal

package main

import (
	"math/rand"

	"gonum.org/v1/plot"
	"gonum.org/v1/plot/plotter"
	"gonum.org/v1/plot/vg"
)

func main() {
	// Get some data to display in our plot.
	rand.Seed(int64(0))
	n := 10
	uniform := make(plotter.Values, n)
	normal := make(plotter.Values, n)
	expon := make(plotter.Values, n)
	for i := 0; i < n; i++ {
		uniform[i] = rand.Float64()
		normal[i] = rand.NormFloat64()
		expon[i] = rand.ExpFloat64()
	}

	// Create the plot and set its title and axis label.
	p := plot.New()

	p.Title.Text = "Horizontal box plots"
	p.X.Label.Text = "Values"

	// Make horizontal boxes for our data and add
	// them to the plot.
	w := vg.Points(20)
	b0, err := plotter.MakeHorizBoxPlot(w, 0, uniform)
	if err != nil {
		panic(err)
	}
	b1, err := plotter.MakeHorizBoxPlot(w, 1, normal)
	if err != nil {
		panic(err)
	}
	b2, err := plotter.MakeHorizBoxPlot(w, 2, expon)
	if err != nil {
		panic(err)
	}
	p.Add(b0, b1, b2)

	// Set the Y axis of the plot to nominal with
	// the given names for y=0, y=1 and y=2.
	p.NominalY("Uniform\nDistribution", "Normal\nDistribution",
		"Exponential\nDistribution")

	if err := p.Save(4*vg.Inch, 3*vg.Inch, "boxplot-horiz.png"); err != nil {
		panic(err)
	}
}
Quartile Plots

package main

import (
	"math/rand"

	"gonum.org/v1/plot"
	"gonum.org/v1/plot/plotter"
)

func main() {
	// Get some data to display in our plot.
	rand.Seed(int64(0))
	n := 10
	uniform := make(plotter.Values, n)
	normal := make(plotter.Values, n)
	expon := make(plotter.Values, n)
	for i := 0; i < n; i++ {
		uniform[i] = rand.Float64()
		normal[i] = rand.NormFloat64()
		expon[i] = rand.ExpFloat64()
	}

	// Create the plot and set its title and axis label.
	p := plot.New()

	p.Title.Text = "Quartile plots"
	p.Y.Label.Text = "Values"

	// Make boxes for our data and add them to the plot.
	q0, err := plotter.NewQuartPlot(0, uniform)
	if err != nil {
		panic(err)
	}
	q1, err := plotter.NewQuartPlot(1, normal)
	if err != nil {
		panic(err)
	}
	q2, err := plotter.NewQuartPlot(2, expon)
	if err != nil {
		panic(err)
	}
	p.Add(q0, q1, q2)

	// Set the X axis of the plot to nominal with
	// the given names for x=0, x=1 and x=2.
	p.NominalX("Uniform\nDistribution", "Normal\nDistribution",
		"Exponential\nDistribution")

	if err := p.Save(3*vg.Inch, 4*vg.Inch, "quartile.png"); err != nil {
		panic(err)
	}
}
Bubble Plots

package main

import (
	"image/color"
	"math/rand"

	"gonum.org/v1/plot"
	"gonum.org/v1/plot/plotter"
	"gonum.org/v1/plot/vg"
)

func main() {
	rand.Seed(int64(0))
	n := 10
	bubbleData := randomTriples(n)

	p := plot.New()

	p.Title.Text = "Bubbles"
	p.X.Label.Text = "X"
	p.Y.Label.Text = "Y"

	bs, err := plotter.NewScatter(bubbleData)
	if err != nil {
		panic(err)
	}
	bs.Color = color.RGBA{R: 196, B: 128, A: 255}
	p.Add(bs)

	if err := p.Save(4*vg.Inch, 4*vg.Inch, "bubble.png"); err != nil {
		panic(err)
	}
}

// randomTriples returns some random x, y, z triples
// with some interesting kind of trend.
func randomTriples(n int) plotter.XYZs {
	data := make(plotter.XYZs, n)
	for i := range data {
		if i == 0 {
			data[i].X = rand.Float64()
		} else {
			data[i].X = data[i-1].X + 2*rand.Float64()
		}
		data[i].Y = data[i].X + 10*rand.Float64()
		data[i].Z = data[i].X
	}
	return data
}
Also see the Creating Custom Plotters page for details on how the Bubbles plotter was implemented.