Debugging Git - git-for-windows/git GitHub Wiki
First of all, Git's .exe files should be rebuilt with debugging information, and without optimization (because gdb has serious troubles single-stepping code compiled using -O2 for some reason). To this end:
- install the Git for Windows SDK
- Create
/usr/src/git/config.makwith the following contents to disable compiler optimization and ASLR:
DEVELOPER=1
ifndef NDEBUG
CFLAGS := $(filter-out -O2,$(CFLAGS))
ASLR_OPTION := -Wl,--dynamicbase
BASIC_LDFLAGS := $(filter-out $(ASLR_OPTION),$(BASIC_LDFLAGS))
endif
- run
makein/usr/src/git/.
After that, you can run Git's executables in GDB like so:
gdb --args ./git.exe --exec-path=/usr/src/git rev-parse HEADSometimes it is useful to ask the debugger to pause the program when the code path is entered that outputs an error message. The functions in Git that output error messages are error_builtin() and die_builtin(). So you can set the breakpoints
b error_builtin
b die_builtin
before calling run in gdb to stop execution at the appropriate time.
When standard input is redirected (e.g. echo "Hello" | gdb -args git ...), gdb will not be able to receive your commands, and therefore you cannot debug. One little trick to get around this is to insert debug statements into the C code such as:
{
    int ddd = 1;
    fprintf(stderr, "Waiting for gdb on pid %d", (int)getpid());
    while (ddd)
        sleep(1);
}
When running this (without prefixing the command with gdb -args), it will print the process ID and then wait. To attach gdb to this process, simply call
gdb git <pid>
then use gdb's up command until you are in that loop, and call set ddd = 0 and continue after setting whatever breakpoints you want to set. Or call finish until the point where you want to single-step (u to single-step, s to single-step into called functions).
The same trick also helps with debugging processes that are spawned from processes that are spawned from the main process.
When a command crashes (i.e. throws a segmentation fault), running it in gdb as described above will stop when the command crashes. Once that is the case, you can obtain a back trace with bt. Example:
(gdb) bt
#0  setup_git_directory_gently_1 (nongit_ok=0x0) at setup.c:846
#1  0x000000000057dfd8 in setup_git_directory_gently (nongit_ok=0x0)
    at setup.c:937
#2  0x000000000057e211 in setup_git_directory () at setup.c:1014
#3  0x0000000000487bfc in cmd_rev_parse (argc=2, argv=0x1951a88, prefix=0x0)
    at builtin/rev-parse.c:589
#4  0x000000000040296a in run_builtin (p=0x5fb8e8 <commands+2184>, argc=2,
    argv=0x1951a88) at git.c:373
#5  0x0000000000402c8d in handle_builtin (argc=2, argv=0x1951a88) at git.c:579
#6  0x0000000000402e2a in run_argv (argcp=0x108fe00, argv=0x108fdb8)
    at git.c:637
#7  0x0000000000402fb9 in cmd_main (argc=2, argv=0x1951a88) at git.c:709
#8  0x000000000049f699 in mingw_main (argc=3, argv=0x1951a80)
    at common-main.c:40
#9  0x000000000049f64d in main (argc=3, argv=0x3230498) at common-main.c:25
This back trace shows which functions were called by which other functions. The inner-most code location is #0, which was called from #1, which was called from #2, etc. In the example above, the main() function called the mingw_main() function which in turn called the cmd_main() function, and so on, until eventually the setup_git_directory_gently() function was called, which then called the setup_git_directory_gently_1() function, where the execution was stopped to let you, the user, inspect the current state in the debugger.
You can inspect the source code at the current code location using the l command (or specify a line number or even a file and a line number like so: l git.c:709, or a function name, like so: l run_builtin).
You can navigate between the different stack frames using up and down (which is confusingly the opposite direction as in the list above).
You can inspect variables' values using p <variable>. This can be a struct, even. Example:
(gdb) p cwd
$1 = {alloc = 129, len = 30, buf = 0x3236cb8 "C:/git-sdk-64/usr/src/git"}
(gdb) p cwd.buf
$2 = 0x3236cb8 "C:/git-sdk-64/usr/src/git"
In some cases, the back trace is not helpful, though, most likely because the stack was somehow messed up. These issues are harder to debug, and require a lot of guess work and patience:
- set a breakpoint on the main function of the command you called, e.g.
cmd_rev_parseforgit rev-parse ...:b cmd_rev_parse - start the debugging session:
r - once execution stops in the main function, try to determine a reasonable next breakpoint by looking at the source:
l(subsequentlcommands will list more,l <lineno>will list from a given line number) - then set another breakpoint and continue:
b <lineno>and thenc - If the crash occurs in between those breakpoints, try to figure out a break point between the last two, i.e. go back to step 3 above (with the difference that the debugging session has to be restarted with
rinstead of continued withc). - If there is actually no line between the two latest breakpoints, i.e. if the crash occurs in a function that was called from the line on which rests the second-latest breakpoint, restart with
rand then step into that function usings. Then repeat as above. - If the crash does not occur between those two breakpoints, disable the first breakpoint (so that subsequent restarts of the debugging session will not stop unnecessarily):
dis <number>(where<number>is the breakpoint's number that was printed when you set it viab <function-or-line>. - Then continue with step 3 above.
GDB (since version 10.1) can use the Pygments Python library, if installed, to syntax-highlight source code, both in the output of the list command as well as in the TUI. To benefit from that feature, simply install Pygments using pacman:
pacman -Syy mingw-w64-x86_64-python-pygmentsFirst, install emacs and run it:
$ pacman -Sy mingw64/mingw-w64-x86_64-emacs
$ emacs
Then type: ESC-x gdb RETURN
It should then prompt you to enter the name of an executable. Give it the full path to the actual executable (such as C:/git-sdk-64/mingw64/libexec/git-core/git-test-dump-index.exe or just git.exe if you want to debug a builtin).
You should get the usual gdb startup banner. At the first prompt, type pwd. For some reason it starts up in the exe's directory rather than the CWD of the shell. So you can cd to the root of the repo you want to work with.
For help, type help.
Type apropos word to search for commands related to "word"...
Reading symbols from c:/git-sdk-64/mingw64/libexec/git-core/git-test-dump-index.exe...done.
(gdb) pwd
Working directory c:\git-sdk-64\mingw64\libexec\git-core.
(gdb) cd e:/testrepo
Working directory e:\testrepo.
(gdb) pwd
Working directory e:\testrepo.
(gdb) b main
Breakpoint 1 at 0x4018da: file test-dump-index.c, line 57.
(gdb) r
Starting program: c:\git-sdk-64\mingw64\libexec\git-core\git-test-dump-index.exe
[New Thread 13028.0x3a50]

Breakpoint 1, 0x00000000004018da in main (argc=1, argv=0x6e0498) at test-dump-index.c:57
57     int main(int ac, char **av)
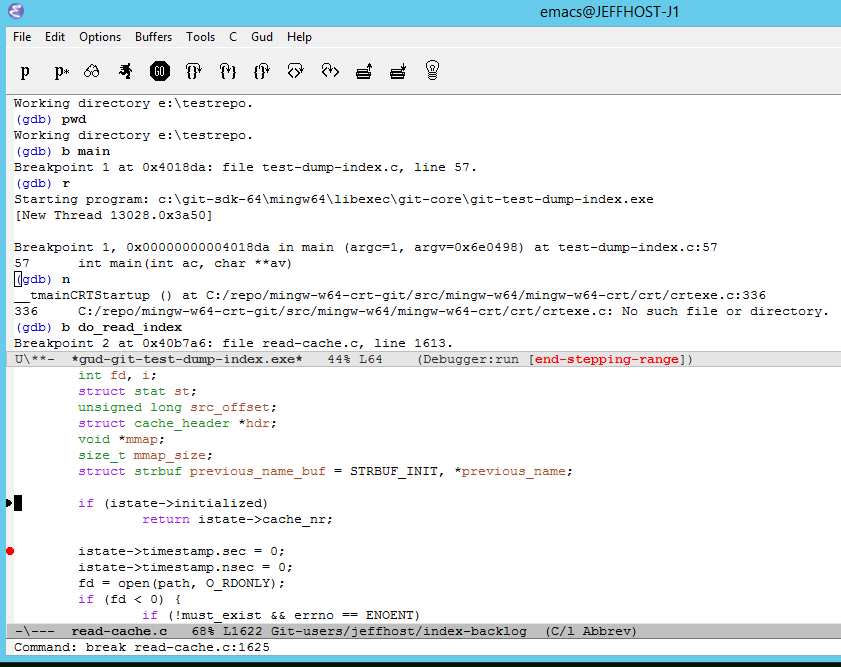
You can then debug like normal (for gdb), but with a split screen and the source in the other panel. there are some toolbar helpers and you can set breakpoints using the left gutter.
Screenshot: