3 cpu monitoring - giordanocardillo/kadira-server GitHub Wiki
navTitle: CPU Monitoring navSubTitle: Monitor client side CPU usage title: Monitor Client Side CPU Usage with Eventloop Blockness
These days, the client side part of a web app does a lot of things. Sometimes, it may become slow for a number of reasons. It may be something to do with your code, or something related to a third party library or package. In those situations, your app might became slow or freeze completely.
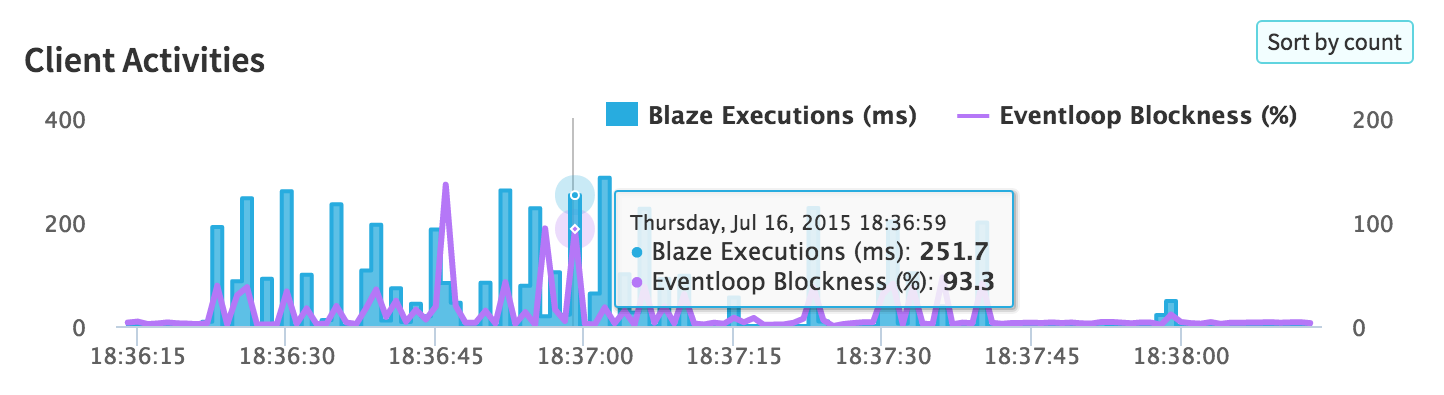
That's where Kadira Debug can help you to detect what's going on. In the Client Activities section, it shows the Eventloop Blockness as a percentage. So, when you see a spike there, you can find out what activities and events happened at the same time.
That will help you to figure out the root cause very quickly and plan your fix.
The Eventloop Blockness percentage is shown in the Client Activities Chart.
It's impossible to track the CPU usage of the browser from the web app itself. So, Kadira Debug can't track it directly. Browsers execute JavaScript in an eventloop. All your code runs in cycles of this eventloop. A lot of CPU activities can block this loop. By measuring the blockness, we can track the CPU usage near perfectly.
The value of eventloop time is calculated as a percentage. Let's say our eventloop blockness value is 40%. That means that 40% of the time your app is busy doing things or other processes on the system are blocking it.
To refresh your knowledge about Eventloop, refer to this article.