2015 11 17 success stories meteor live query monitoring - giordanocardillo/kadira-server GitHub Wiki
title: Success Stories: Meteor’s Live Query Monitoring in Kadira category: meteor summery: We've had a lot of good feedback for the live query monitoring support. Here are some case studies.
We launched Meteor Live Query monitoring support last week. If you haven’t been following this development, read our blog post. Since then, we have had some great feedback from our customers. Let me share some of it with you.
One of our users was seeing somewhat high CPU usage in his app, even though it had only two clients at a time. He tried looking at the graphs on Kadira, like the methods and pub/sub response time charts, but he couldn't find any clues.
Then we launched live query monitoring support in Kadira. Just after the launch, he enabled it and looked at the "Live Queries" tab.
Immediately, he was able to find the problem in his app and he fixed it right away. Have a look at these graphs:
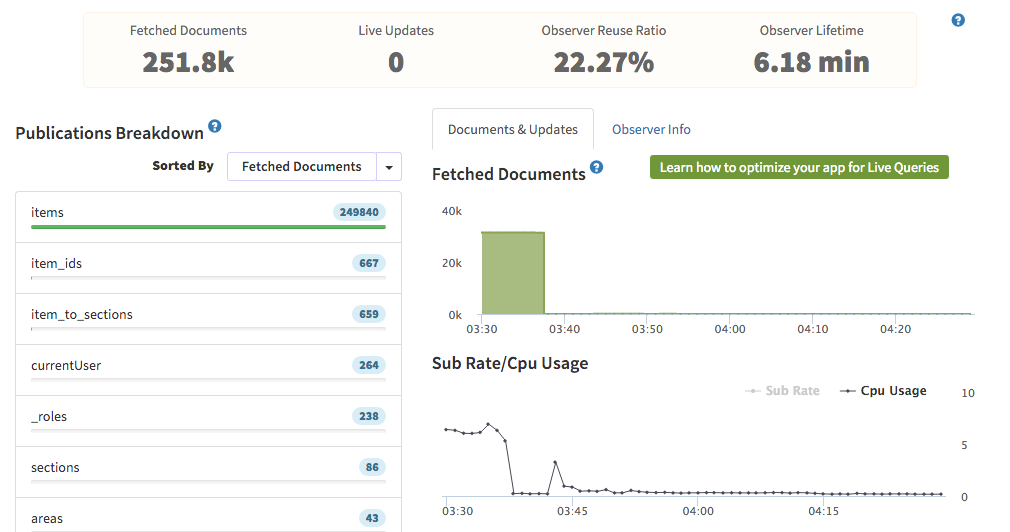
Did you spot the issue?
He was accidentally exposing his whole Items collection via an items publication. After he fixed that publication, the CPU usage dropped rapidly.
A few of our users had some sudden CPU spikes, and they were able to find it with our live query monitoring support.
This is the "Live Queries" tab for one such user:
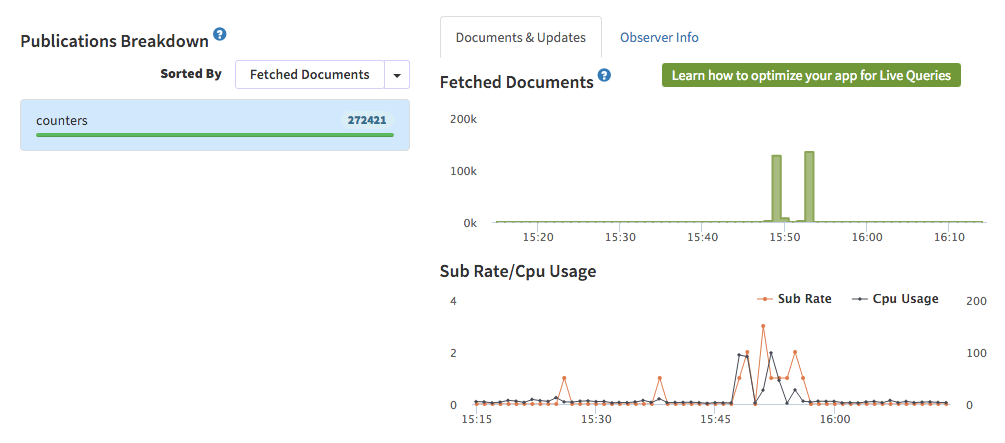
What can you learn from this set of graphs? Have a look at it.
- His app's CPU usage spikes to near 100% suddenly when new users use his app. (SubRate also increased at that time, so that's why we said he was getting new users visiting.)
- If you look at the "Fetched Documents" tab, you can identify the issue.
- The publication
countersfetched a lot of documents to Meteor. He was usingpublish-countsinside that publication.
That was the reason for the high CPU usage by his app. Here's some more information about it.
To count a Mongo query reactively, publish-counts fetches all the documents that match that query to Meteor.(But it won't send them to the client.) This works fine for a small number of documents, but as the document count increases, you will face issues like this.
So, it is always a better idea to count inside the DB.
We've also heard about a lot of apps that receive a huge number of oplog notifications, which leads to higher CPU utilization.
Some of them can simply avoid those notifications by removing high velocity writes from the DB connected to the Meteor app. Others had to disable oplog or do something similar.
We've received a few more case studies, and I'd like to write another blog next week. If you have found any issues, drop us a line (just click the support menu on Kadira). We would be happy to discuss them.