2015 09 08 kadira debug with traces and ddp timeline - giordanocardillo/kadira-server GitHub Wiki
title: Kadira Debug with Traces and DDP Timeline category: product summery: With this version of Kadira Debug, you can analyze your Meteor app with Kadira Traces and with our full-stack DDP Timeline. authorName: Kasun Indi authorProfile: https://twitter.com/_thinkholic
Two months ago, we released Kadira Dedug, which lets you analyze the client-side part of your Meteor app in a very interesting way. We always wanted Kadira Debug to be a full-stack performance debugging solution.
Today, we are taking the initial steps toward this. With this release, you can analyze your Meteor app with Kadira Traces and with our full-stack DDP Timeline.
Now you can see traces for each item listed on the event stream. For example, now you can quickly inspect a trace of what's happening inside the relevant publication. You can also inspect the data sent to the client from that publication.
See it in action:
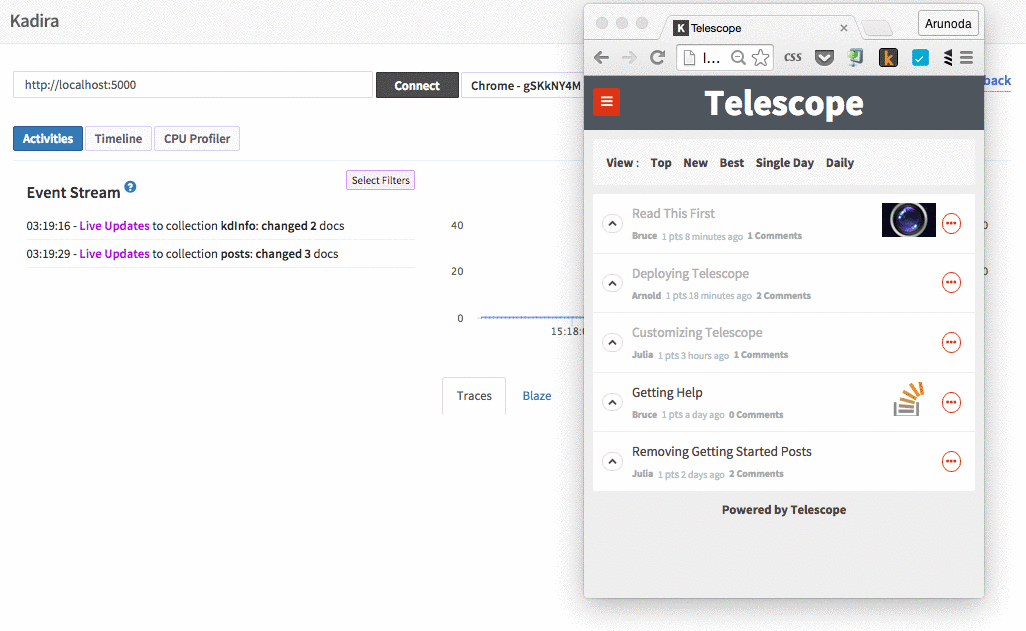
This is the most interesting feature of the new Kadira Debug. DDP Timeline lets you inspect where Meteor subscriptions and methods spend time.
It also let you see the traces related to relevant method and subscription with a time breakdown. Color codes help you get a clear understanding of this at a glance.
Apart from these major changes, we have done some minor UI improvements to smooth your debugging experience.
Try the new Kadira Debug and let us know what you think of it.
If you already using Kadira Debug, just update it to the latest version with
meteor update kadira:debug.