2015 08 25 introducing response time distribution in kadira - giordanocardillo/kadira-server GitHub Wiki
layout: blog_post title: Introducing the Response Time Distribution in Kadira category: product summery: Now you can drill down into individual response times and see the bottlenecks in detail. You can do this with histograms and percentiles.

In Kadira, you can use our trace functionality to find response time bottlenecks in your app. Normally, you could only get five traces for a given time:
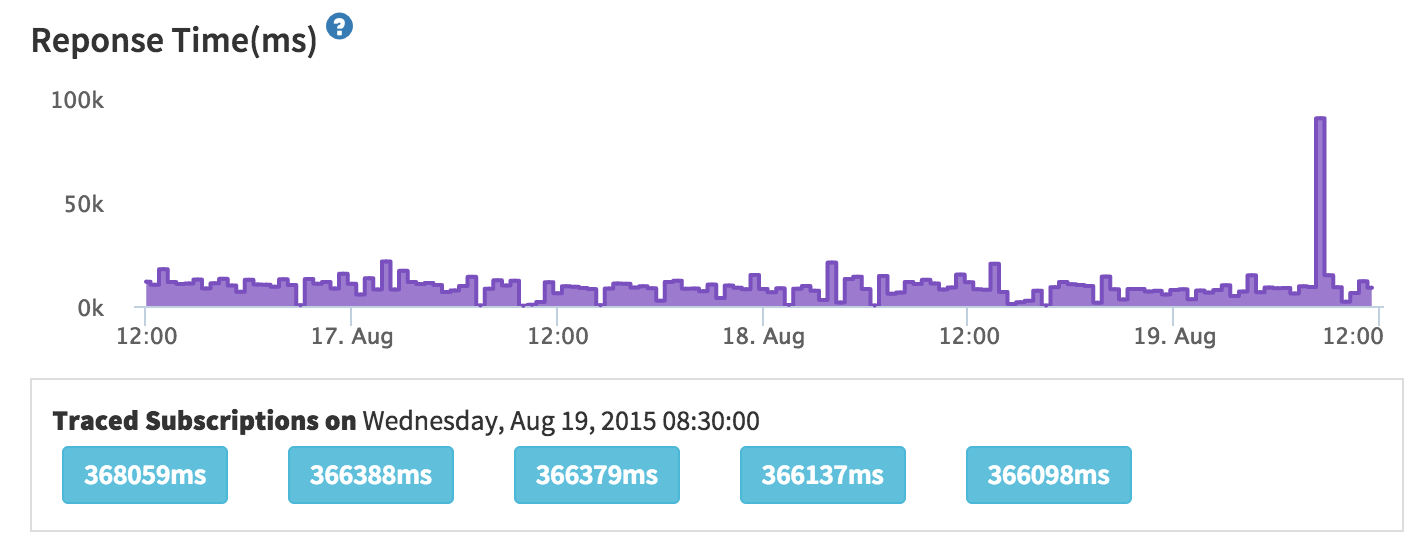
You could use those traces to find the issue. But, you have no way to decide what really happened at that time because those traces could be just five outliers.
That's why today we are introducing the response time distribution feature. It gives a response time histogram at a point in time. Using it and with percentile values, you can easily understand what really happened at that time:
We've created a guide on how you can use the response time distribution in practice.
Response time distribution is available for all our paying users. Give it a try and let us know how it goes.