2015 06 02 kadira 1st anniversary - giordanocardillo/kadira-server GitHub Wiki
layout: academy_post title: Kadira's 1st Anniversary and Beyond category: product summery: It's our 1st Anniversary and we've a great news to share.
We launched Kadira to the public on June 2, 2014. Today is our first anniversary, so it's time to celebrate.

Drop us an email: We'll send you a real cup cake :)
I’d like to share some statistics with you:
- Number of apps using Kadira: 5500
- Number of metrics we process: 500 millions/day
- Size of the Kadira team : 5
It's awesome to see that a lot developers in the Meteor community trust Kadira and use it daily. Personally, it's very nice to hear users mention that they detected an issue or fixed one using Kadira. That's a feeling you cannot buy.
Thank you all!
We've fully covered a lot of server-side internals, like pubsub, methods, CPU profiling, and database tracking. We still have few more things to deliver this year:
- Multi-core support
- SQL/RethinkDB tracking support
- Percentile/histogram support for response times
- NodeJS memory profiling support (to find memory leaks)
We designed Kadira mainly as a production-monitoring solution. However, a lot of developers use it in the dev or staging phases of their applications. Basically, they use Kadira as a "debug" tool.
Right now, Kadira is only for the server side. It would be nice if Kadira could debug the Meteor client as well. That's what we are trying do with Kadira Debug.
It's an end-to-end debugging solution allowing you to see what’s happening on both the server side and the client side using the familiar Kadira interface.
Let's say your app is pretty slow, even in your local machine. But you have no idea where the slowness is coming from. You can track it with Kadira Debug using the following steps:
- Enable Kadira Debug for your app.
- Load your app and play around with it.
- While you are doing that, you can see a lot of details in the Kadira Dashboard in real time.
We are still finalizing the user interface, here's how it'll look like.
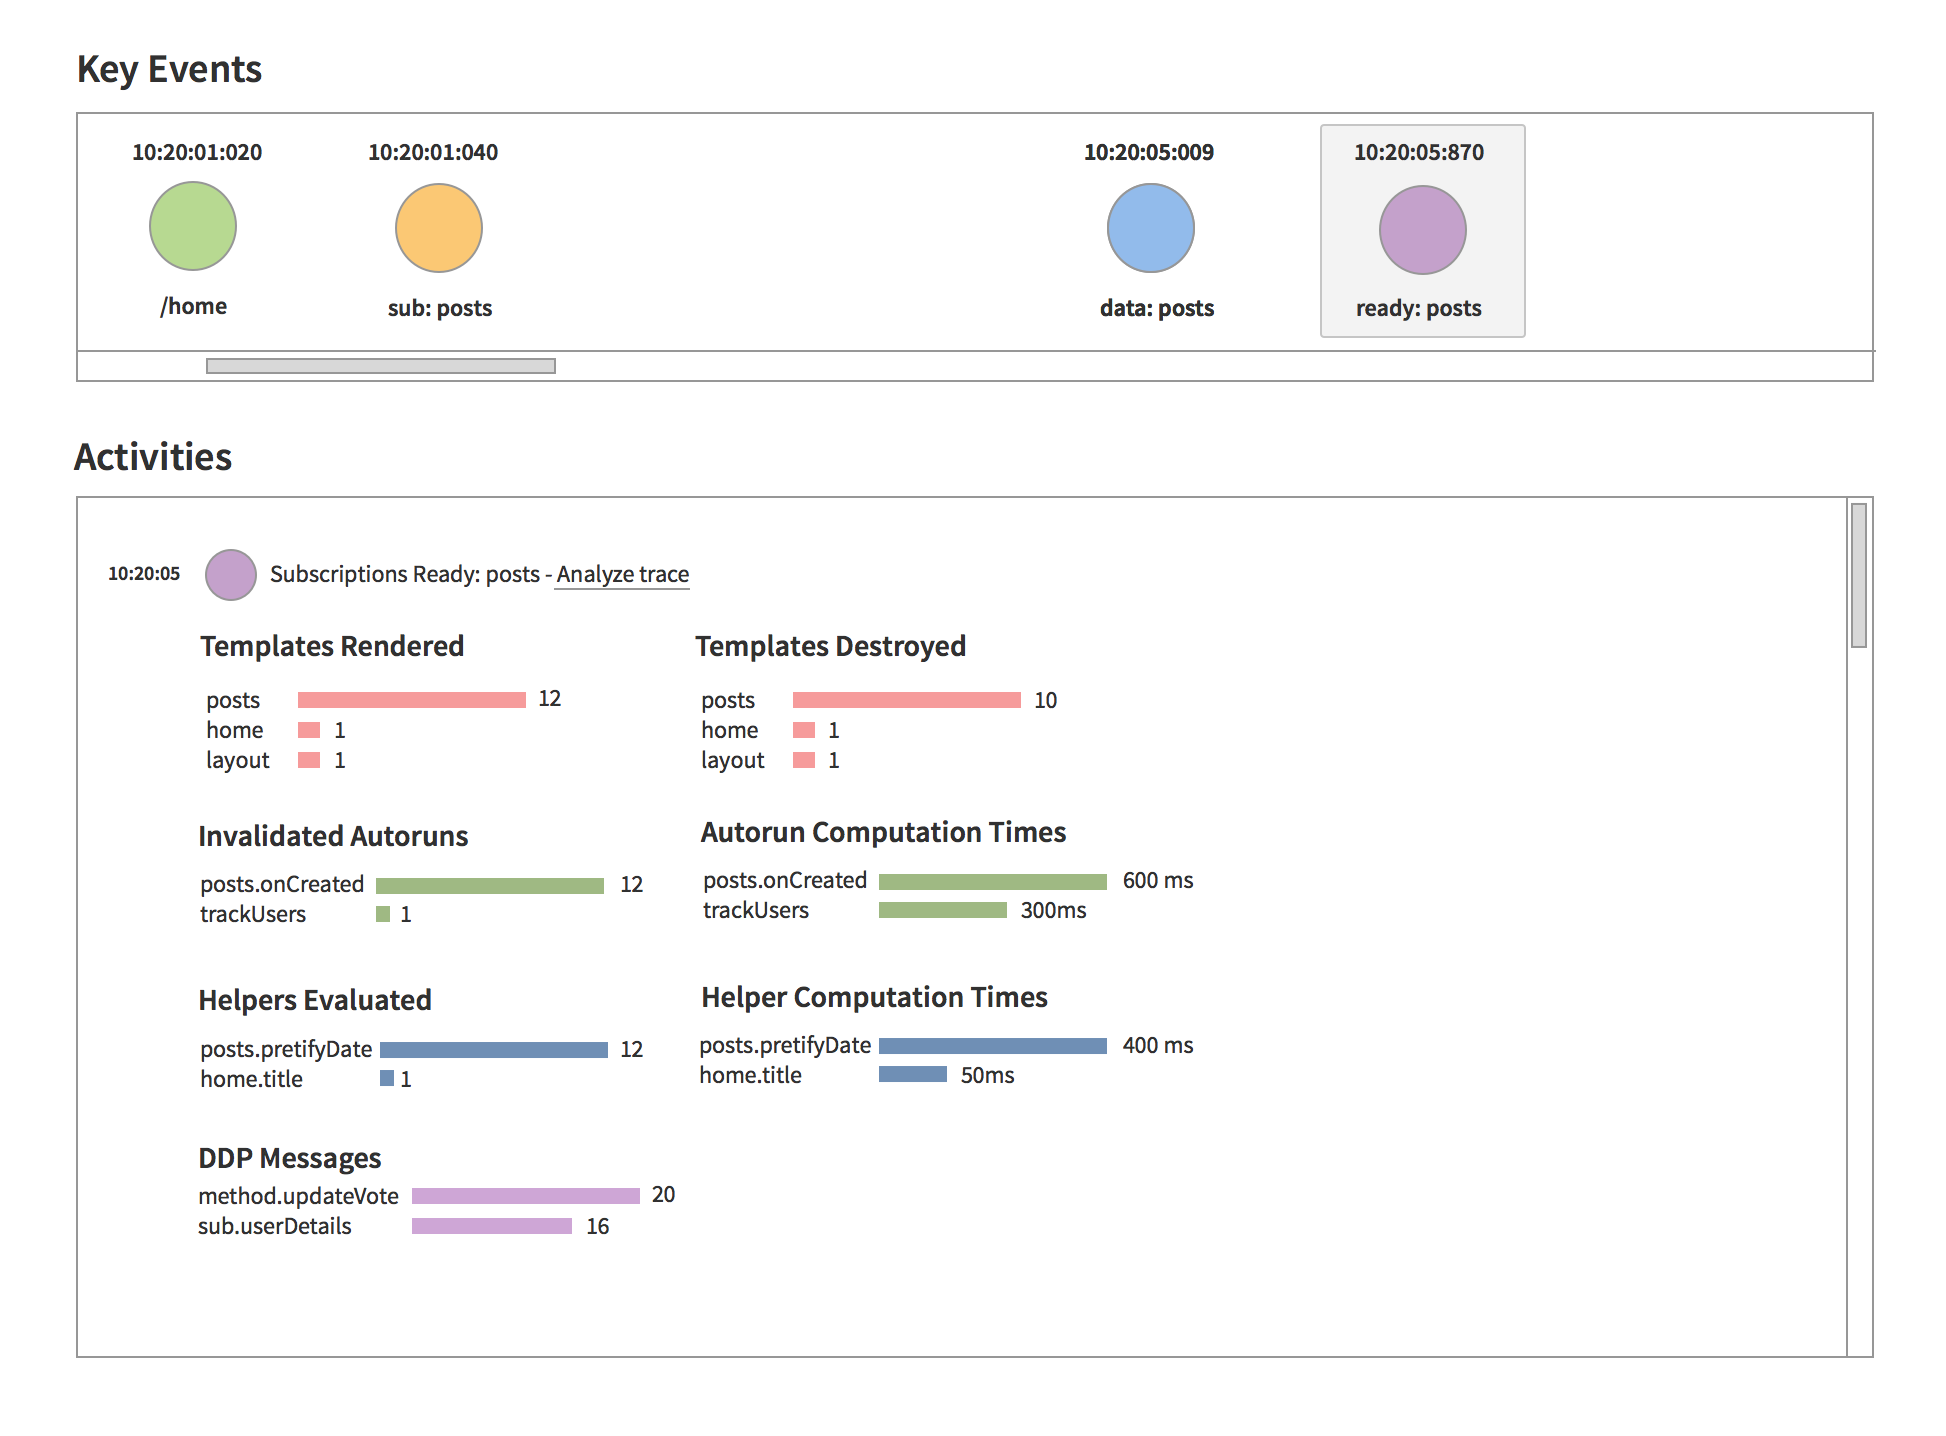
You can see the following details:
- All route changes
- All user events, such as clicks
- Server-side traces, such as method calls and pubsub activity
- Data received from the server
- Created, rendered and destroyed templates
- Executed template helpers
- Invalidated autoruns
- And more
We put all these things in a timeline so you can see which part of your application is responsible for the slowness.
You won't need to wait much longer. We are releasing the initial version of Kadira Debug next week.
I invite you to join me on June 10 at 9 AM PDT for the release of Kadira Debug.I'll show you how to quickly fix hard-to-debug issues using Kadira Debug.
Register Here for MeteorHacks Show - Kadria Debug Edition.
Hope to see you there.