2014 04 14 the april release - giordanocardillo/kadira-server GitHub Wiki
layout: blog_post title: The April Release category: product summery: For the past few weeks, we've been working hard to improve Meteor APM, to allow you to get the most out of it. Today, we are releasing a newer version of APM—it has a lot of changes compared with the previous version.
For the past few weeks, we've been working hard to improve Meteor APM, to allow you to get the most out of it. Today, we are releasing a newer version of APM—it has a lot of changes compared with the previous version.
In order to get the benefit of these features, you must update your
apmsmart-package from the atmosphere.
Let's go through the new features we are introducing today.
With our initial PubSub support, we introduced a metric called Network Impact which showed the amount of data your subscriptions sent to the client. But that original metric was hard to compare and difficult to understand.
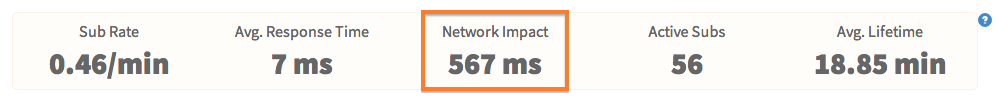
So, we've changed it. Now Network Impact is a metric of time; just like Response Time. It shows the time spent to send your subscriptions data to the client. Network Impact is added to the total latency of your app, so you need to give some attention to that.
For more information, check the documentation.
You can look at the APM’s different metrics yourself to improve your app accordingly. But what if Meteor APM could tell you exactly what you need to improve? Awesome, right?
So, with this release we are introducing certain recommendations, and it will get even better over the coming months.
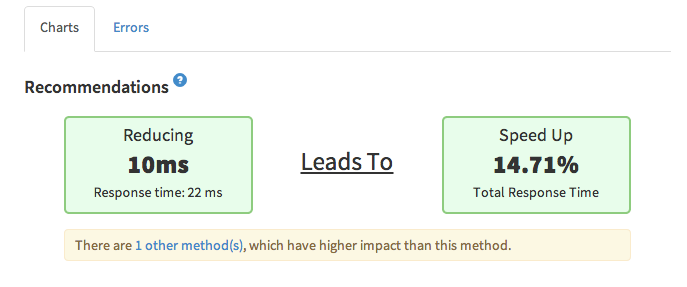
As the first step, you'll be able to see what methods and subscriptions you need to optimize first in order to have the greatest impact on the performance improvements by reducing the response time.
For example, let’s assume that there is a method with a high response time, but it is being called only a few times a day. So, improving that method wouldn't necessarily reduce the total response time of your app.
Meteor APM helps you to understand that.
Just click on a method or any publication, to see the recommendations. As mentioned, this is just the first step—we've more cool stuff to introduce over the coming months.
For more information, refer documentations of both the PubSub Recommendations and the Methods Recommendations.
We already had a costly calls notification system for methods, but even if you saw some spike in the response time, there was no way to check what caused it. So, with this new release, we are introducing tracing support for both Methods and PubSub.
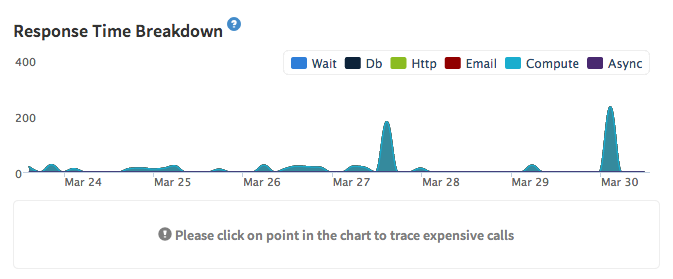
If there is a spike in response time (in the detailed view of either Method or PubSub), just click on the spike and you’ll find the sampled traces at that time. Simply clicking on a trace will allow you to see exactly what's happened in that method call or subscription.
For more information, refer to the documentation.
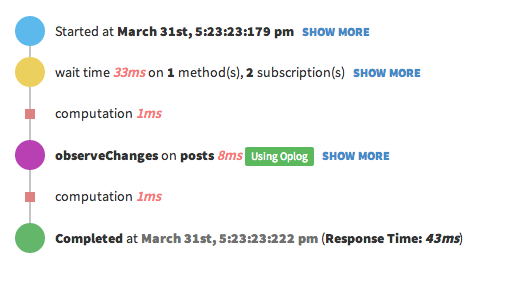
Now Meteor supports Oplog for most of the queries, although it still can't add Oplog support for a smaller subset of queries. Our tracing engine can identify whether your cursors are using the Oplog or not. Just open a trace of a publication and look at the end for the observeChanges. If they are using the Oplog you’ll see a label indicating that.
From today, we are starting the Meteor APM Academy to show you how to improve your application's performace and utilize the resources effectively. I just published two tutorials on the academy. In the upcoming weeks you'll be able to read tutorials on MongoDB indexing, load testing and many other topics.
I hope all these new changes will help you to get more from the Meteor APM and ultimately improve your app and make it better. Currently, we are working on adding administrative features and looking for public release very soon.