2010 10 01 analyze meteor cpu profile - giordanocardillo/kadira-server GitHub Wiki
layout: academy_post title: Analyzing a Meteor CPU Profile permalink: /academy/analyze-meteor-cpu-profile summery: Let's learn how to analyze a CPU profile
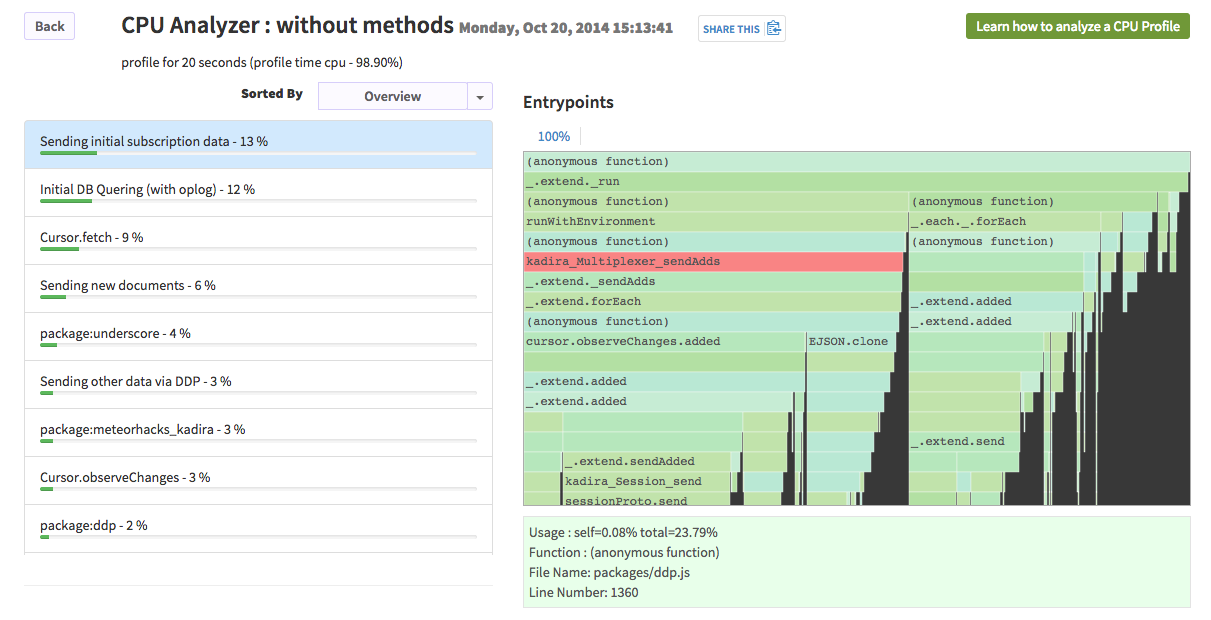
Once you've taken a CPU profile simply click the "Analyze" button and you'll see this
I'll explain each of the items in a moment. Before that, we need to learn some basics.
if you need to play around with a sample CPU profile, click here. CPU profiles taken with Kadira can be shared very easily.
Just like any other application, Meteor processes only one function at a time. A function has a stack from its entrypoint.
The v8-profiler samples and collects functions on the CPU along with their stacks. It is possible for another function in the stack to be on the CPU at another time.
The v8-profiler collect stacks for a given time and aggregates them before compiling the report.
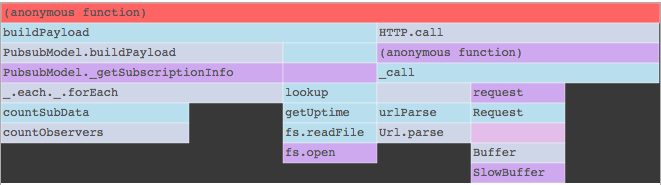
Flamegraph is a very effective way to visualize those functions and stacks. Here is an example flamegraph:
- each bar represents a function in the app,
- the color of the bar has no meaning,
- the length of the bar represents the amount of time it (the function and its children) was on the CPU,
- one function can be a direct parent for one or many functions. In this example,
anonymous functionis the parent for bothbuildPayloadandHTTP.call, - the function (or part of it) on the top is known to be on the CPU. You can think about this another way: functions exposed to the black background are those that stay in the CPU.
Let me explain that further:
-
countObserversis totally on the CPU as it is always on the top of the stack, -
_.each._.forEachspends some of its time on the CPU itself and is also a parent forcountSubData, -
buildPayload,HTTP.calland many others never spend time on the CPU.
When you click on a function, you can see the actual numbers and where the function is located in your code in an information window at the bottom of the flamegraph.
Let me describe the following information window:
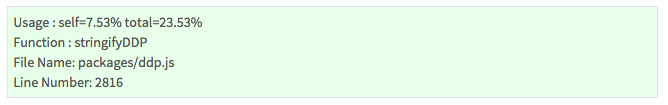
The function stringifyDDP of the ddp package spends 7.53% of time on the CPU and is responsible for 23.53% of the total CPU usage.
You can also see the filename and line number.
As you can see, flamegraphs are very easy to understand, but if we generate a flamegraph for a whole CPU profile it is very hard to visualize. So we are going to group them in two ways, as follows:

We sort functions by amount of time they spend on the CPU. That function could be on different stacks as well as different entrypoints.
We also sort the CPU profile by costly entrypoints. The entrypoint is a place on the bottom of the stack where it has been started. For example:
- when your app receives a DDP message from the client, that is one entrypoint,
- when your app receives data from MongoDB, that is another entrypoint.
You can click on a costly function or an entrypoint to see its related flamegraph. A costly function could belong to one or more entrypoint: these can be seen just above the flamegraph as percentage values. For example, the createWriteReq function spends 89% of the time on one entrypoint and 8% and 3% on another two, respectively.
If you hover the mouse above a bar in the flamegraph, you can see more information. You can click on a function to select it.
Analyzing a CPU profile and finding the root cause is an art; it depends on your app's usage and there is no A-Z guide. Let's try it with our sample CPU profile.
Let's check the stringifyDDP function. It is one of the most-used functions in our app. We could improve that function, but that might not be the root cause of the issue.
There is one parent in the stack called _.extend.sendAdded and that's the root for this. It's the place where Meteor's mongodb observer starts to send data to the client. We could reduce the data we send to the client, which might reduce the CPU usage. Otherwise, we can remove some parts from the stack.
Take CPU profiles for your app and try to analyze them. Then post them to the Kadira Hub and we can discuss them further.