11 kadira insights - giordanocardillo/kadira-server GitHub Wiki
navTitle: navSubTitle: Kadira Insights - Finding Hidden Secrets in Your Meteor App title: Kadira Insights - Finding Hidden Secrets in Your Meteor App enableComments: true
We keep a huge amount of data about your application as metrics. Even though they are just metrics, you can use them to identify patterns in your app. You can use Kadira Insights to play around with those metrics and find hidden secrets.
Kadira Insights can find relationships in your application and make predictions based on those relationships. Thus, you can use it as a capacity planning tool. There are many things you can do with those relationships.
Watch the following video. It's an overview of how to use Kadira Insights. After you’ve seen it, I'll show you what kind of insights you can derive.
<iframe width="853" height="480" src="//www.youtube.com/embed/Xnd2Sa4s4Uk" frameborder="0" allowfullscreen="1"> </iframe>In this guide, I’ll use BulletProof Meteor’s web app as an example.
First, we will try to find some relationships between metrics in that app. Let's begin.
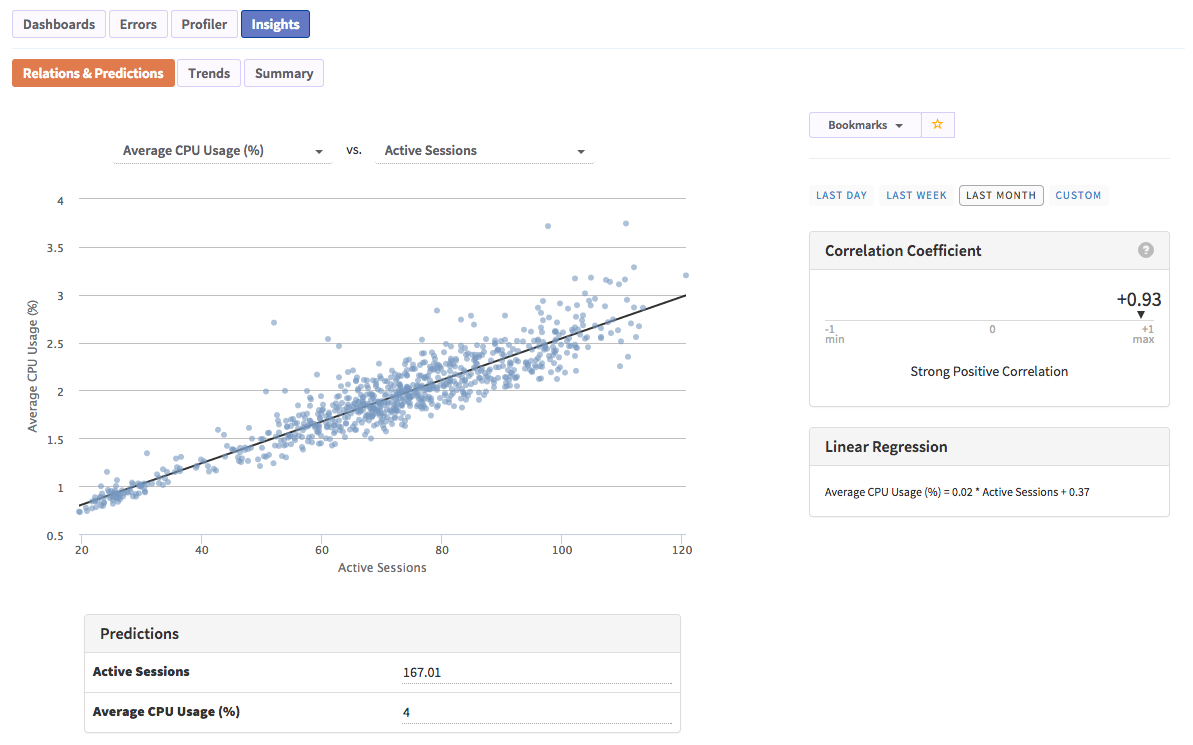
What is responsible for the CPU utilized by the app?
For the above, we will try to relate active sessions and average CPU usage. And there is a very strong relationship (see the correlation coefficient value, which is very close to 1).
Next, look at the slope of the line. We can see that CPU usage is increasing with the number of active sessions. You can also try to relate sub rate and created observers with CPU usage. By doing so you will see some other relations also.
What we can derive from the above relationship?
With this information, we now know that active session, sub rate and some other factors are responsible for the CPU usage directly. If we can reduce the sub rate somehow, that’ll reduce the CPU usage. Likewise, we can take decisions based on the derived information.
Likewise, you can get answers for questions like these as well:
- Does my application require more RAM?
- Is there any relationship between the number of active sessions and RAM?
- Is there any relationship between RAM and CPU usage?
Another useful aspect of Kadira Insights is that it can be used for capacity planning. Let me show you how.
First, let's try to relate CPU usage and RAM.
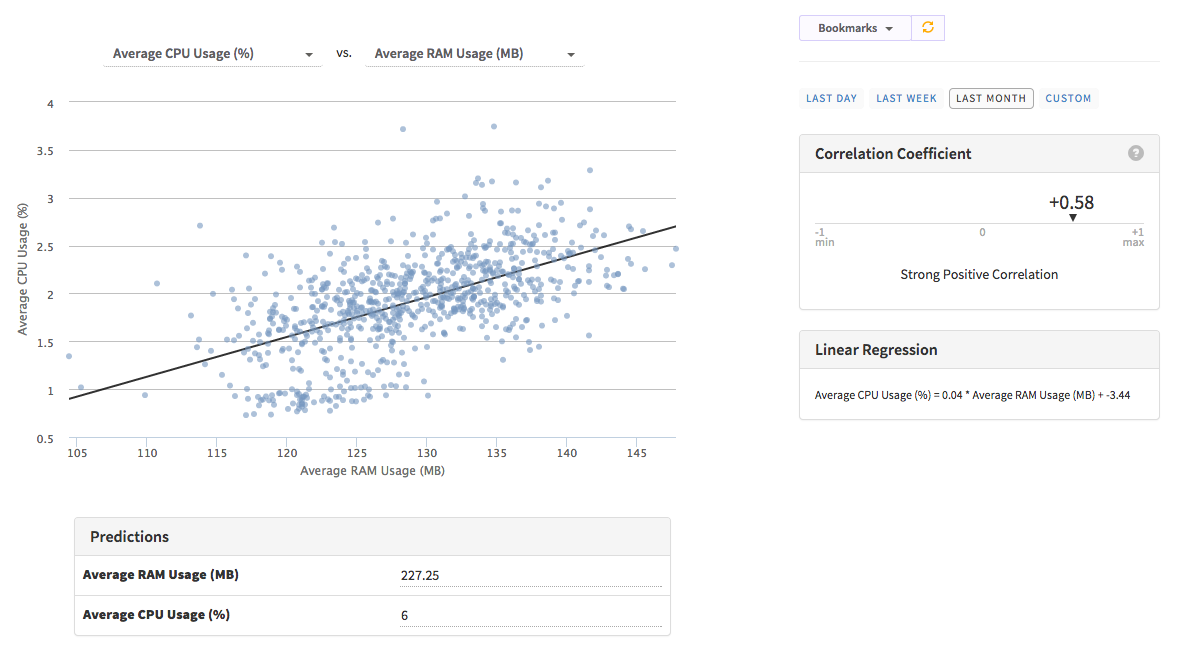
Those two also have a strong relationship. This app is hosted on modulus.io and I know from experience that 6% CPU is the maximum this app can reach. (That’s because modulus.io gives us a shared VM and its CPU usage is capped at ~6%.)
So, now let's try to make some predictions. Based on the above, even if our app uses the maximum CPU, it will only need 227 MB of RAM. But one instance of modulus has 396 MB of RAM. Hence, we know that we need more CPU rather than more RAM. Maybe we can move into another cloud that offers more CPU.
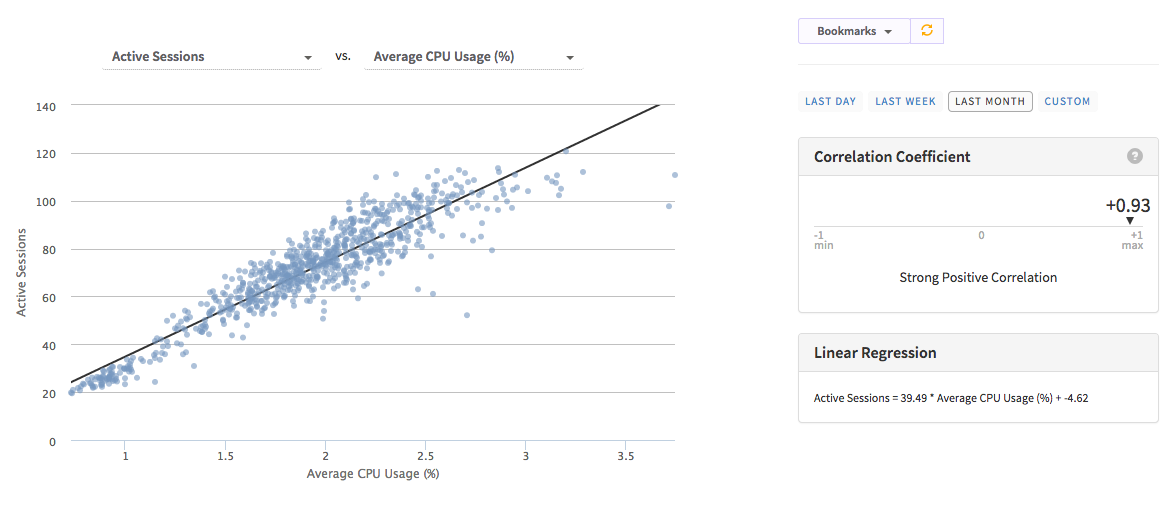
Now, let's try to do the capacity planning. Try to relate active sessions and CPU usage.
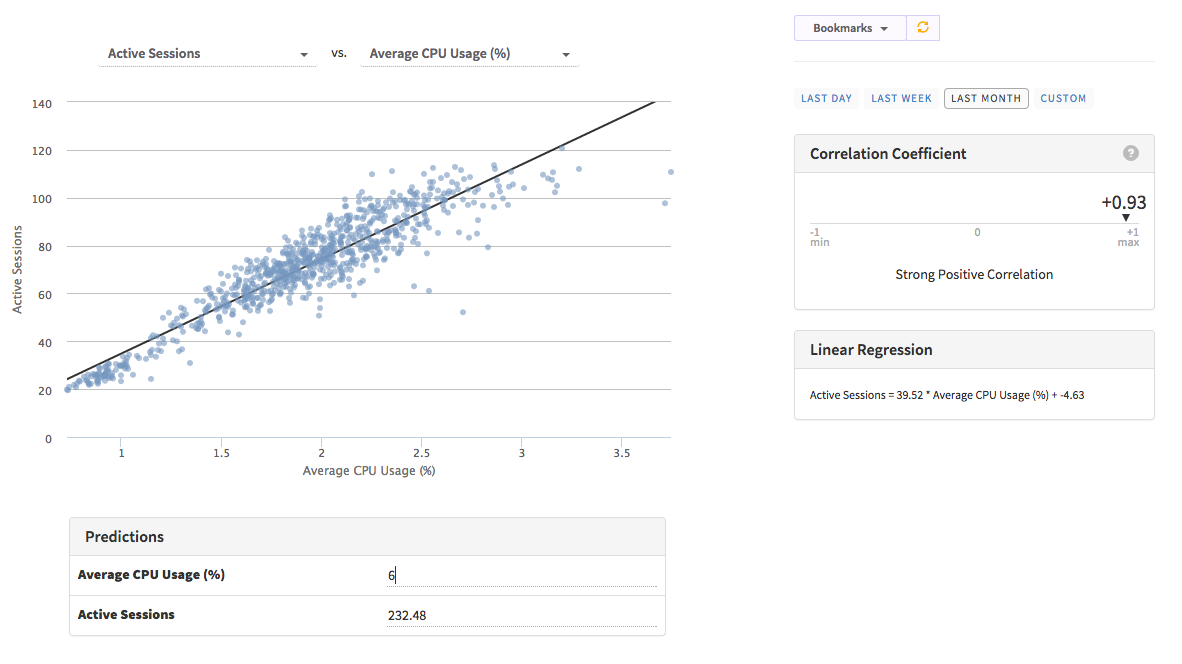
Based on this, we can only have 232 active sessions inside one instance.So, we can predict how many instances we need to handle a given load.
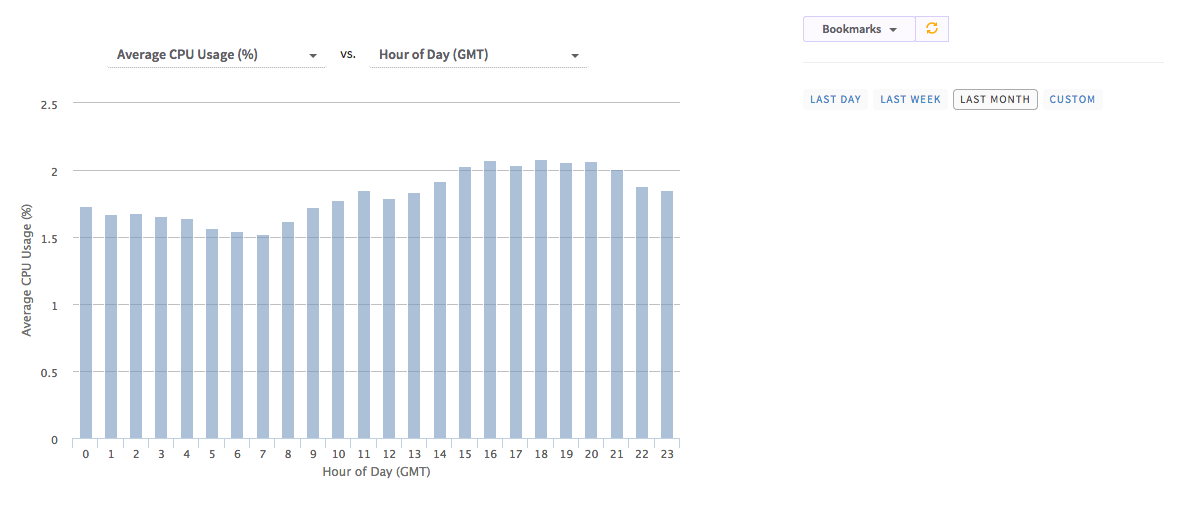
Another useful feature of Kadira Insights is its ability to track trends for almost all the metrics.
The following chart shows the distribution of CPU usage over a day for the last month.
Likewise, with trends we can get answers for the following questions:
- Which days are my users busy?
- How much RAM is needed at the weekend?
- When I do get more errors?
These use cases are just a few uses of Kadira Insights. Now you can mix and match all kinds of metric and discover hidden secrets about your app.
Just visit your app and click on the "Insights" button. This is available for all the users with Pro or higher plans. If you don't have a Pro plan, you can start one week trial to try out Kadira Insights.