1 taking a client profile - giordanocardillo/kadira-server GitHub Wiki
To take a client side profile, you need to use Google Chrome's CPU profiling tool. Watch this video on how to take a CPU profile.
Chrome comes with a built-in CPU profiler. But, our CPU analyzer is much better and easier to understand.
You can also learn how to use Chrome CPU profile with this article.
To use our CPU analyzer, first save Chrome's CPU profiler by clicking the "Save" button on Chrome. See below:
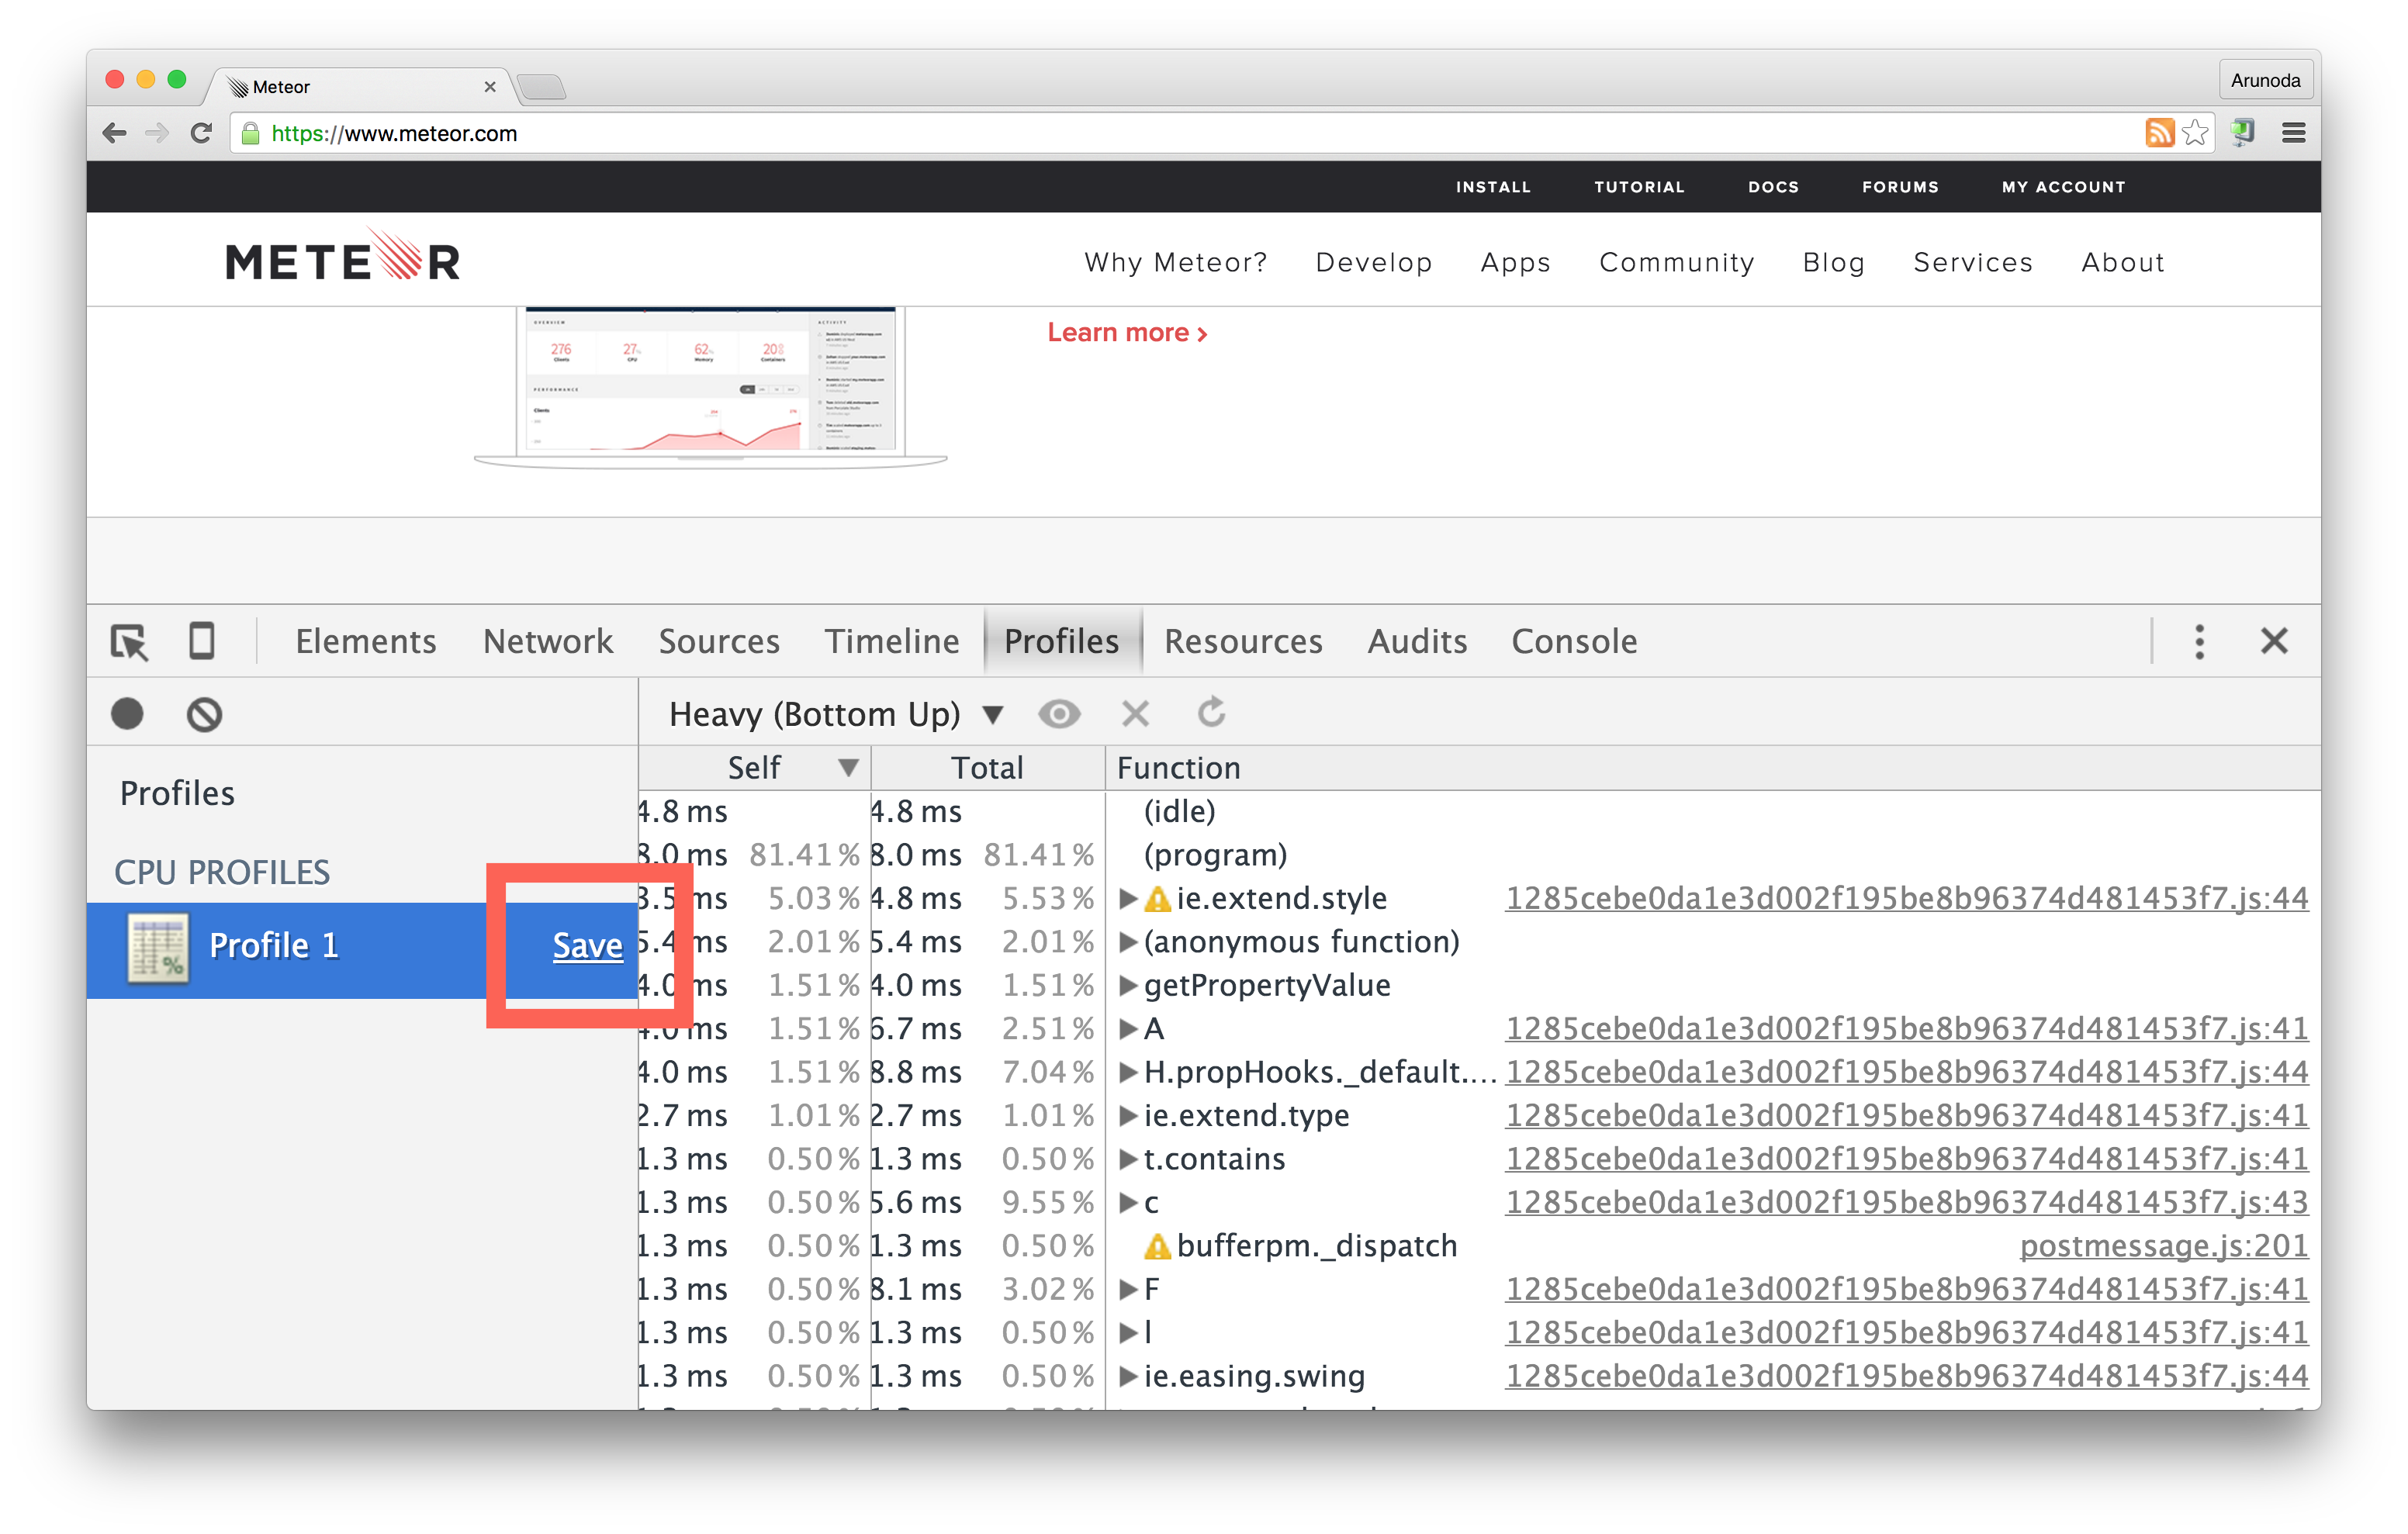
Now visit the Kadira Debug CPU profiling section and load the saved profile.