Intro to Data Science - getfutureproof/fp_guides_wiki GitHub Wiki
What comes to your mind when you think about data science? Data science uses business intelligence along with algorithms and statistics to gain actionable insights into data. Python is a very popular language because it is multi-use. We can use it for backend programming, but it is also used in data science.
In a given data science project the following steps may be observed:
Identifying the problem or area for improvement is the first step. This is what drives the data science process. The business intelligence will clarify the question/s that need answering given the data. Typical questions are:
- How many what amount?
the optimal number of products to assemblehow many staff should I hire
- Which class or category does something fall in?
insurance categoryspam detector
- Detecting Anomalies / odd occurences in the data
online fraud detection
- Suggesting items that a user might like (recommendation systems)
NetflixAmazon
The act of obtaining relevant data from various sources to support your question/project/investigation.
- What is the source of our data?
- Where are we getting our data from?
- Is it all relevant data?
Data often comes in a format that isn’t right for us to use so we have to manipulate it into the right format. What library might you use for this?
- Is it the correct data?
- Is it all relevant?
- Are there Anomalies/Outliers?
Explorational Data Analysis is where we can explore our data and make sense of it in meaningful ways. We can use visualisations and simple statistical analyses to support our understanding and investigation.
- We may use scatter plots, histograms, box plots etc.
- In conjunction with visualisations we can use descriptive statistics like min/max and averages to aid our understanding of the data.
Guided by our exploration of the data above we may have realised some new combinations of the data that could help explain our problem or question. Feature engineering is about creating new data out of existing data that may benefit the models prediction/ accuracy.
- Transforming existing data in some way to bolster the models understanding of the data.
I have a weight column and a height column, so I can calculate a BMI column
A model is a digital representation of a situation, created using existing data. There are plenty of types of models, that are produced by different types of algorithms Which algorithm and model you use is based upon your data and your situation.
It is important to see how accurate our models are so we can improve them. How accurate we want to be will differ depending on the situation. Real world problems often come with a tradeoff between evaluation performance and time taken.
- We should never expect 100% accuracy. This is because when we create a model we are creating predictions, not confirmations.
The Data process is not a linear one. Once we have evaluated, we’ll now need to repeat the above process until we get to the point where we are happy with our model. This often means going back and forth between steps along the process. The data science process is quite cyclical in this sense.
- Once we are happy with our model, we can package it up to be used in the real world. We can now take new pieces of data that come in and predict an output based on it.
The CRISP-DM process - Cross-Industry Standard Process for data mining outlines the steps:

The whole world of data science can be a little murky but it is not hard to find examples of it in use in familiar products.
Netflix
Netflix use a data science algorithm to show us and recommend different shows. Refer here for more info about how Netflix recommends content.
Amazon
Amazon use data science to push us towards products that we might want to buy. See this Article to learn more about how Amazons recommender system works.
Alexa
Home assistants such as Amazon Alexa / Google Home use voice recognition and NLP techniques to automate tasks at home. Refer to this article to learn more about how Alexa works:
Screentime
Screentime is a popular phone app that presents us with confronting statistics about our usage to hopefully improve the balance of how much time we spend on our phone.


A lot of modelling stems from statistics. The way we understand the world reflects on how we make our models. For example let's look at a regression model. A line is fit to data on a graph in a way that best represents the data:
Lets imagine this visualisation of some fake data represents some existing house price data that I have. I have plotted it in two dimensions on an x and y axis as a scatter graph.

The line of best fit can be thought of as a model.
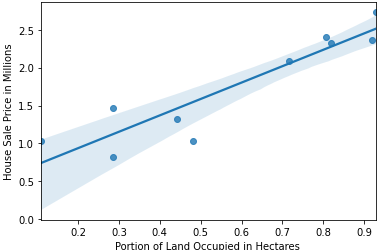
It is a representation of the real world. Maybe not the best it could be, but all models have to start somewhere!
The line of best fit is a statistical method.
What happens if we receive some new data? Using our simple regression model we would be able to predict a value.
- Given a piece of data about the Sale Price of a House we could predict what sort of portion of land it occupies in Hectares
- Given a piece of data about the portion of land a House occupies we could predict its Sale price.
This kind of forecasting or prediction would be useful for a range of uses:
- An online calculator that predicts house prices
- An e-commerce site might use a technique like this to predict how price affects sales.
- How customer activity relates to sales etc.
This isn’t the only type of statistical modelling, there are many more! See this article for more.
Google 'What is Machine Learning?'
Check the wikipedia definition, read it out loud, and ask yourself if you understand it.
It’s a hard to define the term, but the definition we’ll be working with is "Machine Learning is the art of creating models that are refined over time, independent from the data scientists input."
Another buzzword often thrown around is *Artificial Intelligence. this is another hard to define term, but the definition we will be working with is "Artificial Intelligence is a broad goal, an ambition for the computer science community, of which ML is a technique"
Because Machine Learning and AI are buzzwords with plenty of unknowns, it’s important to know what they are not!
- They are not silver bullets that can solve all problems.
- They are not easy to implement and not appropriate for all situations.
It is common to hear about data scientists using deep learning models using artificial neural networks to solve problems that could be handled by regression models like the one above.
We've looked at a statistical model, and now we will spend some time looking at some machine learning modelling techniques and how we might implement them in python.
Broadly speaking there are three types of machine learning techniques:
Supervised Learning:
We give our programme a dataset that is labelled with an output we are trying to predict.
"We are trying to determine if a visitor to our website is a bot or a human." / "I want to know if an email is spam or not."
Unsupervised Learning:
We give our programme a dataset, we don’t know what we are looking for but we would like our algorithm to create groups of pieces of data.
"All of these movies are similar, we know these people like 50% of the movies in that group, so we can recommend another from the same group."
Reinforcement Learning:
We give our programme an environment to work within an a goal to maximise or minimise.
"A child in a new environment whose goal is to minimise the hurt they feel and maximise the fun they experience. They will try out a variety of activities, learning which get them told off or cause them pain and which make them happy."
Let's go through the whole pipeline we described above to create and deploy our own machine learning model.
One of the most popular libraries to use is sklearn. It gives us loads of algorithms built in, but also has some preloaded datasets we can play with. A popular datasets is the iris dataset, which is about flowers.
pip install scikit-learn
from sklearn import datasets
dataset = datasets.load_iris()Luckily sklearn has done that for us with the iris database, so we can skip that for this example.
For this example, we are going to use a decision tree model, which is a type of supervised learning algorithm. This is because the dataset contains three types of flower and we would like to be able to take a new flower and predict what type it is.
from sklearn.tree import DecisionTreeClassifier
model = DecisionTreeClassifier()
model.fit(dataset.data, dataset.target)
model # DecisionTreeClassifier()
Definition of target:
"The dependent variable in supervised (and semisupervised) learning, passed as y to an estimator’s fit method. Also known as dependent variable, outcome variable, response variable, ground truth or label".
Here comes the most important step! Various algorithms have different techniques to help us in this process, for this example however we will be using a confusion matrix which shows us how many guesses we got correct for each potential type of flower.
from sklearn import metrics

expected = dataset.target
predicted = model.predict(dataset.data)
print(metrics.classification_report(expected, predicted))
print(metrics.confusion_matrix(expected, predicted))
precision recall f1-score support
0 1.00 1.00 1.00 50
1 1.00 1.00 1.00 50
2 1.00 1.00 1.00 50
accuracy 1.00 150
macro avg 1.00 1.00 1.00 150
weighted avg 1.00 1.00 1.00 150
[[50 0 0]
[ 0 50 0]
[ 0 0 50]]
- Precision:
correct preds of type x / preds of type x - Recall:
correct preds of type x / actual number of type x - f1 score:
balance between precision vs recall - Accuracy:
total correct preds / total preds made - Support:
actual number of type x
Depending on your use case, you may be prioritising different metrics.
Check out the Sklearn Documentaion for more details on these metrics. For a slightly friendlier desription, try this article.
The values above are innacurate (too perfect!) because we used all of our training data to teach the model about the flowers.
To improve the inaccuracies of our work above, what we actually want is to separate our data into a set of training data and testing data. The standard ratio split is 20% test to 80% train data. This is the proper way to train a model and will avoid overfitting where the model learns from our data too well and struggles to perform on outside data.
We will use a great module from the sklearn.model_selection library called train_test_split. This module will split our data in the default ratio (0.2/0.8) so that we can keep some data to evaluate our model with.
See the sklearn documentation for train_test_split.
from sklearn.model_selection import train_test_split

features_train, features_test, classifier_train,classifier_test = train_test_split(dataset.data, dataset.target)
model.fit(features_train, classifier_train)
predicted = model.predict(features_test)
print(metrics.classification_report(classifier_test, predicted))
print(metrics.confusion_matrix(classifier_test, predicted))
DecisionTreeClassifier()
          precision    recall  f1-score   support

       0       1.00      1.00      1.00         9
       1       1.00      0.93      0.96        14
       2       0.94      1.00      0.97        15

accuracy                           0.97        38
macro avg       0.98      0.98     0.98        38
weighted avg    0.98      0.97     0.97        38

[[ 9  0  0]
[ 0 13  1]
[ 0  0 15]]
### Deploy
We can use a python module to package up our model to be reused in the real world. We do this with a module called [pickle](https://docs.python.org/3/library/pickle.html):

```python
import pickle

pkl_filename = 'flower_classification_model.pkl'
model_pkl = open(pkl_filename, 'wb')

pickle.dump(model, model_pkl)

model_pkl.close()
Then we can reopen the pickle in order to run that predict function again.
model_pkl = open(pkl_filename, 'rb')
model = pickle.load(model_pkl)We’ve shown you one way to write up and package data science projects but there are plenty more resources out there.
- Kaggle is a place data scientists go to collaborate, get data and participates in competitions.
- Tensorflow an end to end open source platform for machine learning and Keras a deep learning API are worth exploring if you have a particular interest in this area.
ML/AI is an often famed phrase, buzzword or similar. But that isn’t really what matters.
Fundamentally, statistics, ML & AI all sit underneath this headline title of Data Science.
Data Science exists to provide us with more indepth products, services and analysis. It is driven by business understanding and under pinned by data / models.