REST API Swagger Demo - ge-high-assurance/RACK GitHub Wiki
This page presents RACK-specific demos of a much larger system that is more fully documented on the SemTK REST cookbook page. Swagger is one of the many ways a REST API can be explored.
Try these first
REST is generic, but fairly low-level approach for integrating with RACK. You may want to explore these options first:
- The RACK Command-line interface (CLI) should meet most high-level needs for interacting with the RACK system
- semtk-python3 can be used to write your own python which access RACK directly
- semtk java contains java executables and java REST clients
If none of these meet your needs, continue with pure REST calls.
Getting Started
To get started with swagger:
- launch a web browser outside of your RACK-in-a-Box container or virtual machine
- check the instructions with your installation instructions to find out how to get the correct IP address
In all the examples below, "localhost" must be replaced with your IP address
To summarize, a typical call sequence for a SELECT query looks like this:
- dispatch a query, and receive a jobId
- wait for the jobId to complete, pinging at a frequency that works in your environment
- retrieve results or message once your job hits 100% complete
The retrieve results step is different depending on what type of original request was issued, and whether it succeeded or failed.
| query type | success | failure |
|---|---|---|
| /dispatchSelect* | /getResultsTable | status message |
| /dispatchConstruct* | /getResultsJsonLd | status message |
| /ingest* | status message | /getResultsTable |
Note that a status message will be recieved as part of the typical process of waiting for job completion. It may also be retrieved using /jobStatusMessage.
The rest of this demo will use swagger to show the step-by-step process of running a typical SELECT query.
Launch a SELECT Query
Remembering to substitute localhost for the appropriate IP, try http://localhost:12058/swagger-ui.html to access the nodegroup execution service. This service is responsible for executing queries using nodegroups already stored in the nodegroup store. Queries are accessed by id, and different endpoints execute different types of queries.
After you reach the page and expand node-group-execution-rest-controller, your screen will look like this:
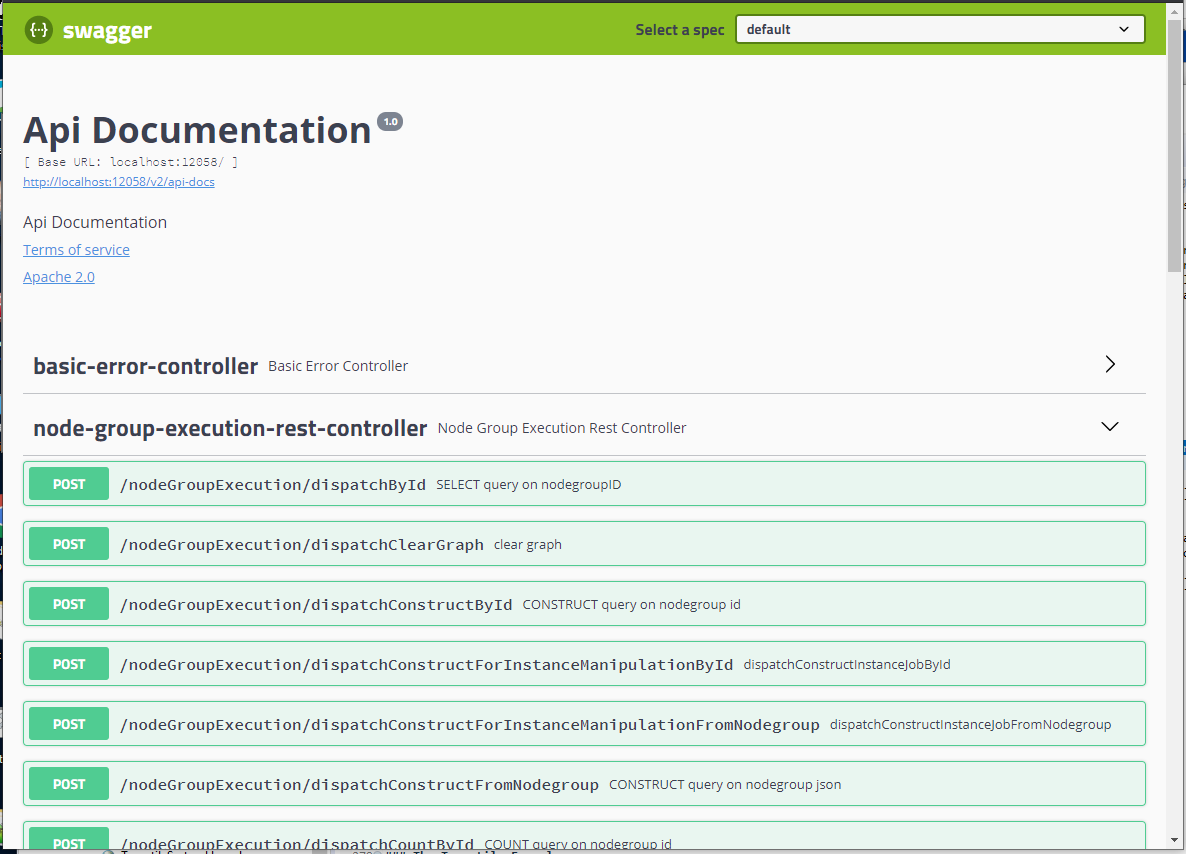
Scroll down to find /nodeGroupExecution/dispatchSelectById and hit the try it out button.
You should see a screen like this:
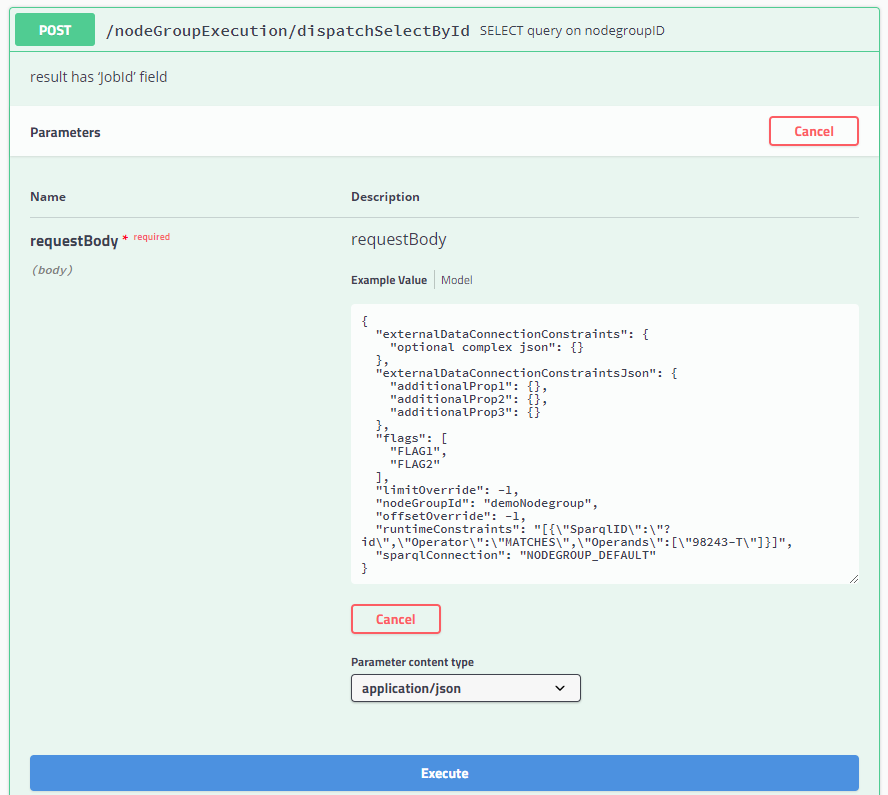
Paste the following code into the requestBody field:
{
  "nodeGroupId": "query Hazard structure",
  "runtimeConstraints": "[{\"SparqlID\":\"?hazard\",\"Operator\":\"MATCHES\",\"Operands\":[\"H-1.2\"]}]",
  "sparqlConnection": "NODEGROUP_DEFAULT"
}
and hit "Execute" (the large blue button). Scroll down to find a responseBody that looks like this:
{
  "message": "operations succeeded.",
  "status": "success",
  "simpleresults": {
    "JobId": "req_1edd26ec-04f2-4393-b1a2-4cb5a01b2ed0"
  }
}
This response indicates that:
- the job launch succeeded
- there is a JobId
Copy your JobId for the next step.
Waiting for Completion
When you run this demo by hand, your job will complete before you have the chance to check it. Nevertheless, an application might ping every few seconds, or it might have a status bar and want a response every 10% of completion.
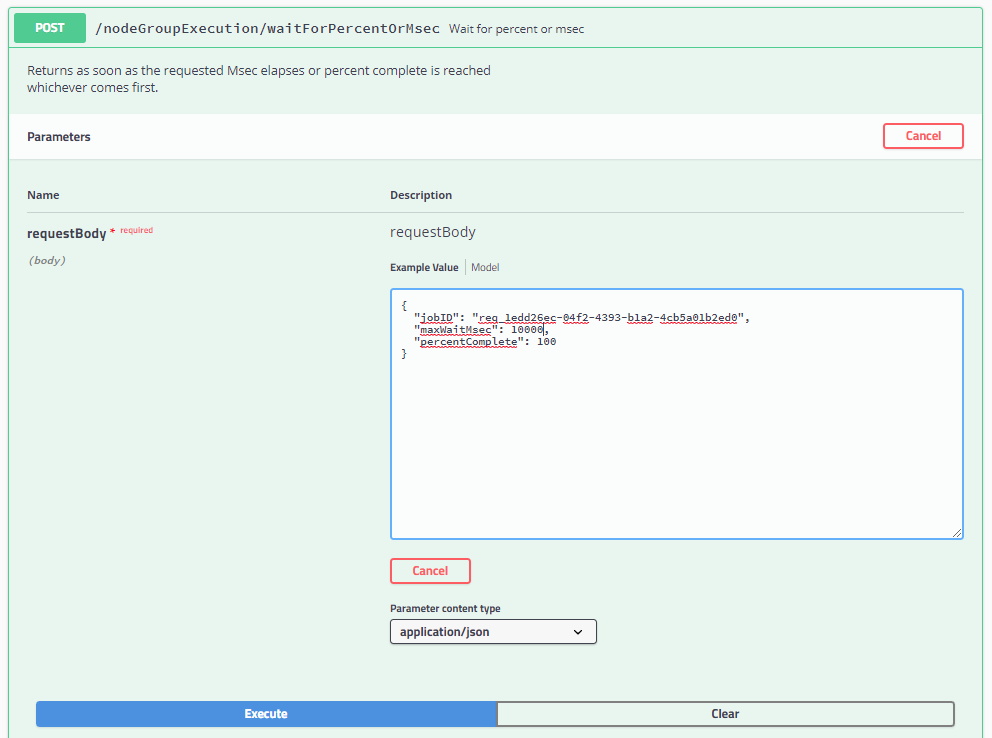
These are achieved with waitForPercentOrMsec
Scroll down your swagger page and click on this entry and hit "Try it out".
Fill in the parameters with:
- your jobId from the dispatch step (which will be different than the one shown here "req_1edd26ec-04f2-4393-b1a2-4cb5a01b2ed0")
- the maximum number of milliseconds to wait, we'll use 10000 (10 seconds)
- the maximum completion percent, we'll use 100
The screen will look like this (but with your jobId):
When you hit execute you will receive back:
{
  "message": "operations succeeded.",
  "status": "success",
  "simpleresults": {
    "percentComplete": "100",
    "statusMessage": "",
    "status": "Success"
  }
}
These can be interpretted as:
- the wait succeeded
- the job
- is 100% complete
- issued no status message
- was successful
Retrieving results
For a SELECT query, results are in table form. The previous step confirmed that the job is completed without error. Therefore, in the same manner which was used to use /waitForPercentOrMsec, scroll to /nodeGroupExecution/getResultsTable and issue a "Try it now" with the same job id.
You will see these results, which corresponds to the table with 8 rows and 4 columns. The calling software is responsible for parsing and displaying this JSON, using the API support tools listed on the REST cookbook page.
{
  "message": "operations succeeded.",
  "table": {
    "@table": {
      "col_names": [
        "testcase",
        "req",
        "hazard",
        "source"
      ],
      "rows": [
        [
          "TC-1-1",
          "HLR-1",
          "H-1.2",
          "H-1"
        ],
        [
          "TC-1-2",
          "HLR-1",
          "H-1.2",
          "H-1"
        ],
        [
          "TC-1-3",
          "HLR-1",
          "H-1.2",
          "H-1"
        ],
        [
          "TC-1-4",
          "HLR-1",
          "H-1.2",
          "H-1"
        ],
        [
          "TC-1-1",
          "HLR-1",
          "H-1.2",
          "TurnStileSystem"
        ],
        [
          "TC-1-2",
          "HLR-1",
          "H-1.2",
          "TurnStileSystem"
        ],
        [
          "TC-1-3",
          "HLR-1",
          "H-1.2",
          "TurnStileSystem"
        ],
        [
          "TC-1-4",
          "HLR-1",
          "H-1.2",
          "TurnStileSystem"
        ]
      ],
      "type": "TABLE",
      "col_type": [
        "literal",
        "literal",
        "literal",
        "literal"
      ],
      "col_count": 4,
      "row_count": 8
    }
  },
  "status": "success"
}