Pyverilog Tutorial - gayatri267/PyverilogTutorial GitHub Wiki
Python-based Hardware Design Processing Toolkit for Verilog HDL Pyverilog is an open-source hardware design processing toolkit for Verilog HDL.
This software includes various tools for Verilog HDL design.
- vparser: Code parser to generate AST (Abstract Syntax Tree) from source codes of Verilog HDL.
- dataflow: Dataflow analyzer with an optimizer to remove redundant expressions and some dataflow handling tools.
- controlflow: Control-flow analyzer with condition analyzer that identify when a signal is activated.
- ast_code_generator: Verilog HDL code generator from AST(Abstract Syntax Tree).
You can create your own design analyzer, code translator and code generator of Verilog HDL based on this toolkit.
- Python (2.7, 3.3 or later)
- Icarus Verilog (0.9.6 or later)
- pyverilog.vparser.preprocessor.py uses 'iverilog -E' command as the preprocessor.
- Graphviz and Pygraphviz (Python3 does not support Pygraphviz)
- pyverilog.dataflow.graphgen and pyverilog.controlflow.controlflow (without --nograph option) use Pygraphviz (on Python 2.7).
- Jinja2 (2.7 or later)
- ast_code_generator requires jinja2 module.
git clone [email protected]:gayatri267/PyverilogTutorial.git
If you are using Linux, you can directly follow the instructions. In case you are using Windows, please install Bash for Windows using the link https://www.howtogeek.com/249966/how-to-install-and-use-the-linux-bash-shell-on-windows-10/. It will make the process easier.
Please make sure you have python2.7 installed before continuing with this tutorial. Some of the commands in this tutorial can only be run using Python 2.7, while others can be run using Python 2.7 or Python 3 (We will specify during the commands if python2.7 is to be explicitly used)
-
Go into the pyverilog-0.9.1 directory in the cloned repository cd pyverilog-0.9.1
-
Install iverilog as below
sudo apt-get install iverilog -
Install Pygraphviz as below (Note that Python3 does not support Pygraphviz and hence only Python2.7 version is to be installed)
sudo apt-get install -y python-pygraphviz -
Install Jinja 2 as below
sudo apt install python-pip pip install jinja2 -
Install the pyverilog library using setup.py.
- If Python 2.7 is used,
sudo python setup.py install- If Python 3.x is used,
sudo python3 setup.py install
Let's try to use pyverilog tools on the verilog module fsm.v (already present in the pyverilog-0.9.1 directory).
fsm.v is a priority arbiter which takes two requests req_0 and req_1(req_0 is of higher priority) and generates two outputs gnt_0 and gnt_1
The verilog code for priority arbiter is as follows
module fsm (
clock      , // clock
reset      , // Active high, syn reset
req_0      , // Request 0
req_1      , // Request 1
gnt_0      , // Grant 0
gnt_1
);
//-------------Input Ports-----------------------------
input   clock,reset,req_0,req_1;
 //-------------Output Ports----------------------------
output  gnt_0,gnt_1;
//-------------Input ports Data Type-------------------
wire    clock,reset,req_0,req_1;
//-------------Output Ports Data Type------------------
reg     gnt_0,gnt_1;
//-------------Internal Constants--------------------------
parameter SIZE = 3           ;
parameter IDLE  = 3'b001,GNT0 = 3'b010,GNT1 = 3'b100 ;
//-------------Internal Variables---------------------------
reg   [SIZE-1:0]          state        ;// Seq part of the FSM
reg   [SIZE-1:0]          next_state   ;// combo part of FSM
//----------Code startes Here------------------------
always @ (state or req_0 or req_1)
begin : FSM_COMBO
 next_state = 3'b000;
 case(state)
   IDLE : if (req_0 == 1'b1) begin
                next_state = GNT0;
              end else if (req_1 == 1'b1) begin
                next_state= GNT1;
              end else begin
                next_state = IDLE;
              end
   GNT0 : if (req_0 == 1'b1) begin
                next_state = GNT0;
              end else begin
                next_state = IDLE;
              end
   GNT1 : if (req_1 == 1'b1) begin
                next_state = GNT1;
              end else begin
                next_state = IDLE;
              end
   default : next_state = IDLE;
  endcase
end
//----------Seq Logic-----------------------------
always @ (posedge clock)
begin : FSM_SEQ
  if (reset == 1'b1) begin
    state <=  #1  IDLE;
  end else begin
    state <=  #1  next_state;
  end
end
//----------Output Logic-----------------------------
always @ (posedge clock)
begin : OUTPUT_LOGIC
if (reset == 1'b1) begin
  gnt_0 <=  #1  1'b0;
  gnt_1 <=  #1  1'b0;
end
else begin
  case(state)
    IDLE : begin
                  gnt_0 <=  #1  1'b0;
                  gnt_1 <=  #1  1'b0;
               end
   GNT0 : begin
                   gnt_0 <=  #1  1'b1;
                   gnt_1 <=  #1  1'b0;
                end
   GNT1 : begin
                   gnt_0 <=  #1  1'b0;
                   gnt_1 <=  #1  1'b1;
                end
   default : begin
                    gnt_0 <=  #1  1'b0;
                    gnt_1 <=  #1  1'b0;
                  end
  endcase
end
end // End Of Block OUTPUT_LOGIC

endmodule // End of Module arbiter
Code parser is for syntax analysis. Please type the command as below.
python pyverilog/vparser/parser.py fsm.v
The result of syntax analysis is displayed.
Source:
  Description:
    ModuleDef: fsm
      Paramlist:
      Portlist:
        Port: clock, None
        Port: reset, None
        Port: req_0, None
        Port: req_1, None
        Port: gnt_0, None
        Port: gnt_1, None
      Decl:
        Input: clock, False
          Width:
            IntConst: 0
            IntConst: 0
        Input: reset, False
          Width:
            IntConst: 0
            IntConst: 0
        Input: req_0, False
          Width:
            IntConst: 0
            IntConst: 0
        Input: req_1, False
          Width:
            IntConst: 0
            IntConst: 0
             ....
             ....
             ....
             ....
              Case:
                  Block: None
                    NonblockingSubstitution:
                      Lvalue:
                        Identifier: gnt_0
                      Rvalue:
                        IntConst: 1'b0
                      DelayStatement:
                        IntConst: 1
                    NonblockingSubstitution:
                      Lvalue:
                        Identifier: gnt_1
                      Rvalue:
                        IntConst: 1'b0
                      DelayStatement:
                        IntConst: 1
Let's try dataflow analysis. It is used to establish the relationship between outputs with inputs and states
python pyverilog/dataflow/dataflow_analyzer.py -t fsm fsm.v
The result of each signal definition and each signal assignment are displayed.
Directive:
Instance:
(fsm, 'fsm')
Term:
(Term name:fsm.next_state type:{'Reg'} msb:(Operator Minus Next:(Terminal fsm.SIZE),(IntConst 1)) lsb:(IntConst 0))
(Term name:fsm._rn0_next_state type:{'Rename'} msb:(Operator Minus Next:(Terminal fsm.SIZE),(IntConst 1)) lsb:(IntConst 0))
(Term name:fsm.gnt_0 type:{'Reg', 'Output'} msb:(IntConst 0) lsb:(IntConst 0))
(Term name:fsm._rn2_next_state type:{'Rename'} msb:(Operator Minus Next:(Terminal fsm.SIZE),(IntConst 1)) lsb:(IntConst 0))
(Term name:fsm._rn3_next_state type:{'Rename'} msb:(Operator Minus Next:(Terminal fsm.SIZE),(IntConst 1)) lsb:(IntConst 0))
(Term name:fsm._rn6_next_state type:{'Rename'} msb:(Operator Minus Next:(Terminal fsm.SIZE),(IntConst 1)) lsb:(IntConst 0))
....
....
....
....
(Bind dest:fsm.state tree:(Branch Cond:(Operator Eq Next:(Terminal fsm.reset),(IntConst 1'b1)) True:(Terminal fsm.IDLE) False:(Terminal fsm.next_state)))
(Bind dest:fsm._rn6_next_state tree:(Terminal fsm.GNT1))
(Bind dest:fsm.IDLE tree:(IntConst 3'b001))
(Bind dest:fsm.GNT0 tree:(IntConst 3'b010))
(Bind dest:fsm.SIZE tree:(IntConst 3))
(Bind dest:fsm._rn1_next_state tree:(Terminal fsm.GNT0))
(Bind dest:fsm._rn8_next_state tree:(Terminal fsm.IDLE))
(Bind dest:fsm.gnt_1 tree:(Branch Cond:(Operator Eq Next:(Terminal fsm.reset),(IntConst 1'b1)) True:(IntConst 1'b0) False:(Branch Cond:(Operator Eq Next:(Terminal fsm.state),(Terminal fsm.IDLE)) True:(IntConst 1'b0) False:(Branch Cond:(Operator Eq Next:(Terminal fsm.state),(Terminal fsm.GNT0)) True:(IntConst 1'b0) False:(Branch Cond:(Operator Eq Next:(Terminal fsm.state),(Terminal fsm.GNT1)) True:(IntConst 1'b1) False:(Branch Cond:(IntConst 1) True:(IntConst 1'b0)))))))
(Bind dest:fsm.GNT1 tree:(IntConst 3'b100))
(Bind dest:fsm._rn4_next_state tree:(Terminal fsm.GNT0))
(Bind dest:fsm._rn7_next_state tree:(Terminal fsm.IDLE))
(Bind dest:fsm._rn5_next_state tree:(Terminal fsm.IDLE))
To view the result of dataflow analysis as a picture file, need to run the command as below (we select output port 'fsm.gnt_0' as the target for example)
python2.7 pyverilog/dataflow/graphgen.py -t fsm -s fsm.gnt_0 fsm.v
(Note that only python2.7 can be used to this command as it internally uses Pygraphviz)
out.png file will now be generated which has the definition of 'gnt_0'.
Control-flow analysis can be used to picturize how the state diagram of the RTL module look like
python2.7 pyverilog/controlflow/controlflow_analyzer.py -t fsm fsm.v
(Note that only python2.7 can be used to this command as it internally uses Pygraphviz)
We get the output as below, which shows the state machine structure and transition conditions to the next state in the state machine.
FSM signal: fsm.gnt_1, Condition list length: 4
Condition: (Eq,), Inferring transition condition
Condition: (Ulnot, Eq), Inferring transition condition
Condition: (Ulnot, Ulnot, Eq), Inferring transition condition
Condition: (Ulnot, Ulnot, Ulnot), Inferring transition condition
FSM signal: fsm.gnt_0, Condition list length: 3
Condition: (Eq,), Inferring transition condition
Condition: (Ulnot, Eq), Inferring transition condition
Condition: (Ulnot, Ulnot), Inferring transition condition
FSM signal: fsm.state, Condition list length: 8
Condition: (Eq, Eq), Inferring transition condition
Condition: (Eq, Ulnot, Ulnot), Inferring transition condition
Condition: (Ulnot, Eq, Eq), Inferring transition condition
Condition: (Ulnot, Ulnot, Ulnot), Inferring transition condition
Condition: (Eq, Ulnot, Eq), Inferring transition condition
Condition: (Ulnot, Eq, Ulnot), Inferring transition condition
Condition: (Ulnot, Ulnot, Eq, Ulnot), Inferring transition condition
Condition: (Ulnot, Ulnot, Eq, Eq), Inferring transition condition
# SIGNAL NAME: fsm.state
# DELAY CNT: 0
0 --None--> 1
1 --((!(fsm_req_0==1'd1))&&(!(fsm_req_1==1'd1)))--> 1
1 --(fsm_req_0==1'd1)--> 2
1 --((!(fsm_req_0==1'd1))&&(fsm_req_1==1'd1))--> 4
2 --(fsm_req_0==1'd1)--> 2
2 --(!(fsm_req_0==1'd1))--> 1
3 --None--> 1
4 --(!(fsm_req_1==1'd1))--> 1
4 --(fsm_req_1==1'd1)--> 4
5 --None--> 1
6 --None--> 1
7 --None--> 1
Loop
(1, 2)
(2,)
(1,)
(1, 4)
(4,)
fsm_state.png is also generated which is the graphical representation of the state machine.
Finally, pyverilog can be used to generate verilog code from the AST representation of RTL. We will be using 'test.py' for demonstrate.
A Verilog HDL code is represented by using the AST classes defined in 'vparser.ast'.
Run the below command to see how AST representation in test.py gets translated to verilog code.
python test.py
Verilog code generated from the AST instance is as below:
module top
 (
  input [0:0] CLK,
  input [0:0] RST,
  output [7:0] led
 );
  assign led = 8;
endmodule
Let's try to use pyverilog tools on the verilog module test.v (already present in the pyverilog-0.9.1 directory) This sample design adds the input value internally when the enable signal is asserted. Then it outputs its partial value to the LED.
Code parser is for syntax analysis. Please type the command as below.
python pyverilog/vparser/parser.py test.v
The result of syntax analysis is displayed.
Source:
  Description:
    ModuleDef: top
      Paramlist:
      Portlist:
        Ioport:
          Input: CLK, False
            Width:
              IntConst: 0
              IntConst: 0
        Ioport:
          Input: RST, False
            Width:
              IntConst: 0
              IntConst: 0
        Ioport:
          Input: enable, False
            Width:
              IntConst: 0
              IntConst: 0
            .......
            .......
            .......
            .......
                  IfStatement:
                    Eq:
                      Identifier: state
                      IntConst: 2
                    Block: None
                      NonblockingSubstitution:
                        Lvalue:
                          Identifier: count
                        Rvalue:
                          Plus:
                            Identifier: count
                            Identifier: value
                      NonblockingSubstitution:
                        Lvalue:
                          Identifier: state
                        Rvalue:
                          IntConst: 0
Let's try dataflow analysis. It is used to establish the relationship between outputs with inputs and states.
python pyverilog/dataflow/dataflow_analyzer.py -t top test.v
The result of each signal definition and each signal assignment are displayed.
Directive:
Instance:
(top, 'top')
Term:
(Term name:top.led type:{'Output'} msb:(IntConst 7) lsb:(IntConst 0))
(Term name:top.enable type:{'Input'} msb:(IntConst 0) lsb:(IntConst 0))
(Term name:top.CLK type:{'Input'} msb:(IntConst 0) lsb:(IntConst 0))
(Term name:top.count type:{'Reg'} msb:(IntConst 31) lsb:(IntConst 0))
(Term name:top.state type:{'Reg'} msb:(IntConst 7) lsb:(IntConst 0))
(Term name:top.RST type:{'Input'} msb:(IntConst 0) lsb:(IntConst 0))
(Term name:top.value type:{'Input'} msb:(IntConst 31) lsb:(IntConst 0))
Bind:
(Bind dest:top.count tree:(Branch Cond:(Terminal top.RST) True:(IntConst 0) False:(Branch Cond:(Operator Eq Next:(Terminal top.state),(IntConst 0)) False:(Branch Cond:(Operator Eq Next:(Terminal top.state),(IntConst 1)) False:(Branch Cond:(Operator Eq Next:(Terminal top.state),(IntConst 2)) True:(Operator Plus Next:(Terminal top.count),(Terminal top.value)))))))
(Bind dest:top.state tree:(Branch Cond:(Terminal top.RST) True:(IntConst 0) False:(Branch Cond:(Operator Eq Next:(Terminal top.state),(IntConst 0)) True:(Branch Cond:(Terminal top.enable) True:(IntConst 1)) False:(Branch Cond:(Operator Eq Next:(Terminal top.state),(IntConst 1)) True:(IntConst 2) False:(Branch Cond:(Operator Eq Next:(Terminal top.state),(IntConst 2)) True:(IntConst 0))))))
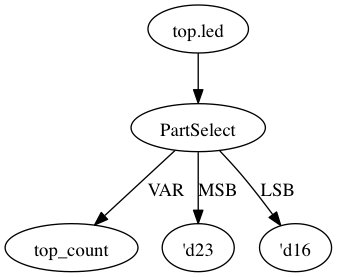
(Bind dest:top.led tree:(Partselect Var:(Terminal top.count) MSB:(IntConst 23) LSB:(IntConst 16)))
To view the result of dataflow analysis as a picture file, you need to run the command as below (we select output port 'led' (an output port) as the target for example)
python2.7 pyverilog/dataflow/graphgen.py -t top -s top.led test.v
(Note that only python2.7 can be used to this command as it internally uses Pygraphviz)
out.png file will now be generated which has the definition of 'led' is a part-selection of 'count' from 23-bit to 16-bit.
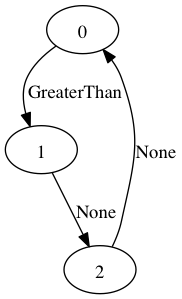
Control-flow analysis can be used to picturize how the state diagram of the RTL module looks like.
python2.7 pyverilog/controlflow/controlflow_analyzer.py -t top test.v
(Note that only python2.7 can be used to this command as it internally uses Pygraphviz)
We get the output as below, which shows the state machine structure and transition conditions to the next state in the state machine.
FSM signal: top.count, Condition list length: 4
FSM signal: top.state, Condition list length: 5
Condition: (Ulnot, Eq), Inferring transition condition
Condition: (Eq, top.enable), Inferring transition condition
Condition: (Ulnot, Ulnot, Eq), Inferring transition condition
# SIGNAL NAME: top.state
# DELAY CNT: 0
0 --(top_enable>'d0)--> 1
1 --None--> 2
2 --None--> 0
Loop
(0, 1, 2)
top_state.png is also generated which is the graphical representation of the state machine.
- This python tool would be very using for RTL design/verification engineers to picturize the state machines and output functions to quickly glance for bugs.
- The controlflow graph portrays the state transitional relationships, but could be enhanced to show the input signals and their values that cause the transition from one state to another.
This tutorial is based on official python documentation for pyverilog - https://pypi.python.org/pypi/pyverilog/0.9.1