Handling Data - g7kse/CanSat GitHub Wiki
The data that is passed from the CanSat to the ground station is crucial. The primary mission data is going to be what is most important. Demonstrating the change in temperature and pressure is generally the least amount of information required. There is no right way to do this but going back to the requirements section of the project will help to ensure that the team has met its goals.
Easy to handle data formats
As always, beginning with the end in mind, the project team should consider how they are going to collect and handle data. The format that the data can be dealt with can, once again, vary. However, there are formats that are easier to handle in spreadsheet applications for example.
Text (.txt) files
Simple and easy to write. The Adafruit tutorial gives us all the information we need to achieve this programmatically. The output will be a file with that has a data without any delimiter (something that differentiates between each 'block' of data). An example might be
CansatId Temperature Pressure
This type of data can be read into spreadsheets but it is possible to introduce errors because a space or decimal point can confuse the program that its being imported into
Comma Separated Variable (.csv) files
This format is a far more common way to handle data in spreadsheets. Just like the text file, data is written in lines but by using a comma we introduce a way of a spreadsheet to know when one 'block' of data has been complete and the next one starts. the method of writing the data is still the same, just the output changes to something like
CansatId,Temperature,Pressure
JSON
To further expand the data handling the use of JSON (JavaScript Object Notation) can be explored to help move from spreadsheets to web based services. The formatting is more complex and will need careful setting up but ultimately gives the team the best available set of options for handling outside of a simple spreadsheet. the output format is something like
{
  "CanSat Id": "Team CanSat",
  },
  "PrimaryData": [
    {
      "type": "Temperature",
      "number": "20"
    },
    {
      "type": "Pressure",
      "number": "1010"
    }
  ],
  "SecondaryData": [
    {
      "type": "Other data",
      "number": "xxx"
    }
    {
      "type": "More data",
      "number": "yyy"
    }
   ],
}
You can see that this requires more programming skills but might be a way of presenting data in a different way
Writing data to the CanSat MCU
The Adafruit tutorial mentioned before shows us how to write data to the MCU. We can do this on the CanSat itself, either to the internal memory or to an SD card.The method is straightforward and the Adafruit tutorial will help. Writing data to the CanSat MCU is practical but ignores the option to send data to the ground station, but it could be a handy backup so don't ignore the option.
There is one small issue that seems to crop up. Making the MCU writable can put it into a tailspin every now and again, so being able to stop the loop with Ctrl 'C' in Thonny can get you out of it.
Writing data to the ground station MCU
As with writing to the CanSat MCU, we can do the same using the ground station MCU. The same method applies and the same potential access tailspin can also happen. testing is the key.
Collecting data from the console
There are a couple of methods here. Data is written to the console (in Thonny for example) and it could be simply cut and paste into a text file to make a CSV file for example. Not recommended, but can get you out of a pickle.
What to do with the data
.txt or .csv file can easily be handled in Libre Office Calc or other spreadsheets like Excel. These guides should help you import that data to produce your own dashboard
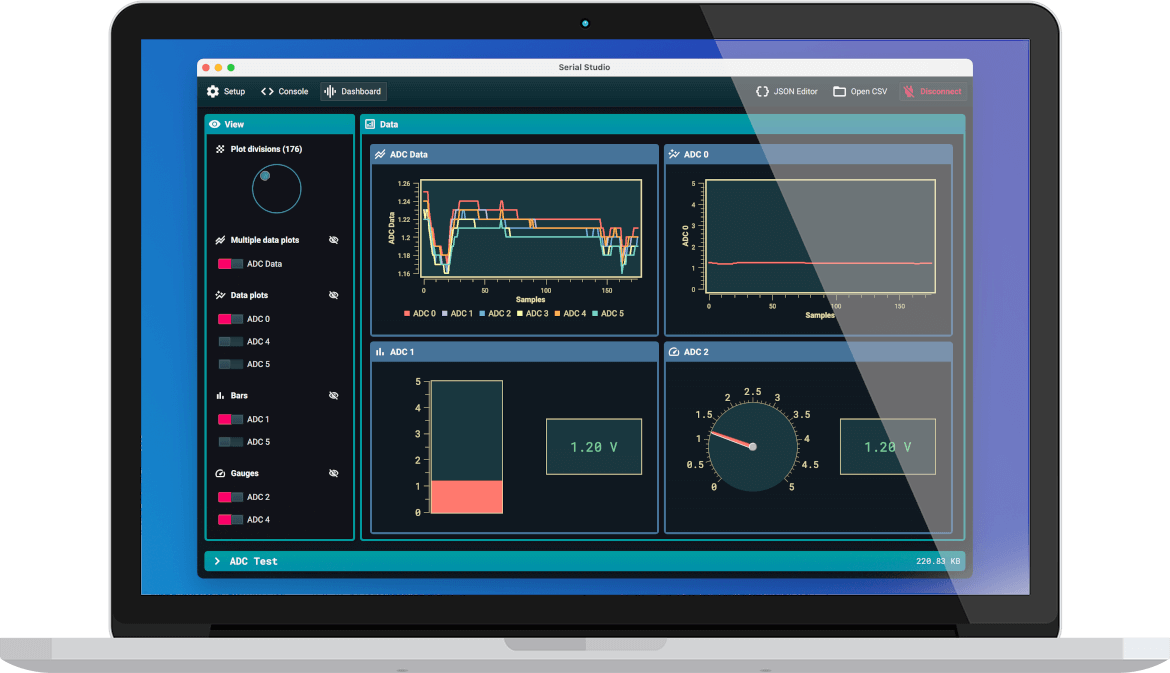
A more elegant solution is to 'pipe' the data into something else, like a dashboard or a graph. Matplotlib might offer a solution for the curious, or a ready made dashboard solution is Serial Studio could be just what you're after.

This method makes use of data as json objects. Luckily for us we can use the example below as the json data file then all we need to do is top and tail the sent data with the standard /* and */ for the application to know what constitutes the data frame. using our earlier example this could be
/*CansatId,Temperature,Pressure*/
An example JSON file for this could be as below, this frame also includes
{
    "frameEnd": "",
    "frameStart": "",
    "groups": [
        {
            "datasets": [
                {
                    "alarm": 0,
                    "fft": false,
                    "fftSamples": 1024,
                    "graph": false,
                    "led": false,
                    "log": false,
                    "max": 0,
                    "min": 0,
                    "title": "CanSat Id",
                    "units": "C",
                    "value": "%1",
                    "widget": ""
                },
                {
                    "alarm": 0,
                    "fft": false,
                    "fftSamples": 1024,
                    "graph": true,
                    "led": false,
                    "log": false,
                    "max": 0,
                    "min": 0,
                    "title": "Temperature",
                    "units": "C",
                    "value": "%2",
                    "widget": ""
                },
                {
                    "alarm": 0,
                    "fft": false,
                    "fftSamples": 1024,
                    "graph": true,
                    "led": false,
                    "log": false,
                    "max": 0,
                    "min": 0,
                    "title": "Pressure",
                    "units": "HPa",
                    "value": "%3",
                    "widget": ""
                }
            ],
            "title": "New Group",
            "widget": ""
        }
    ],
    "separator": "",
    "title": "CanSat Example"
}