0c Source code analysis tools - ftsrg-edu/swsv-labs GitHub Wiki
Prerequisites:
Goal: We will try out two static analysis tools for verifying source code.
FindBugs
NOTE: You could try out FindBugs successor called SpotBugs instead of FindBugs.
Getting FindBugs
FindBugs is a simple tool that concentrates on finding problems that matter without many false positives. It has not been updated recently, but it still works well, that is why we recommend it.
FindBugs can be used from command line and from a graphical user interface as well, but in this lab we will use the Eclipse plug-in. This requires an Eclipse IDE. To install the FindBugs plug-in, do the following steps.
- Go to Help / Install New Software....
- At the top of the window, type http://findbugs.cs.umd.edu/eclipse/ into the field Work with and press enter.
- In the list select FindBugs and proceed with the installation. Restarting Eclipse will be required at the end.
Importing a project
A project called json.simple will serve as our example on the lab but you can also use your own projects. Import the project with the following steps.
- Go to File / Import and select General / Existing Projects into Workspace.
- Instead of selecting the root directory, go to the option Select archive file and browse the file. Press Finish to import the project.
Running FindBugs
- To run FindBugs on a project, right-click on the project name in the package or project explorer window and select Find Bugs / Find Bugs.
- After the process finished switch to Find Bugs perspective (Figure 1) under Window / Perspective / Open Perspective / Other....
- Inspect the errors along with their description and the code. Are these real errors?
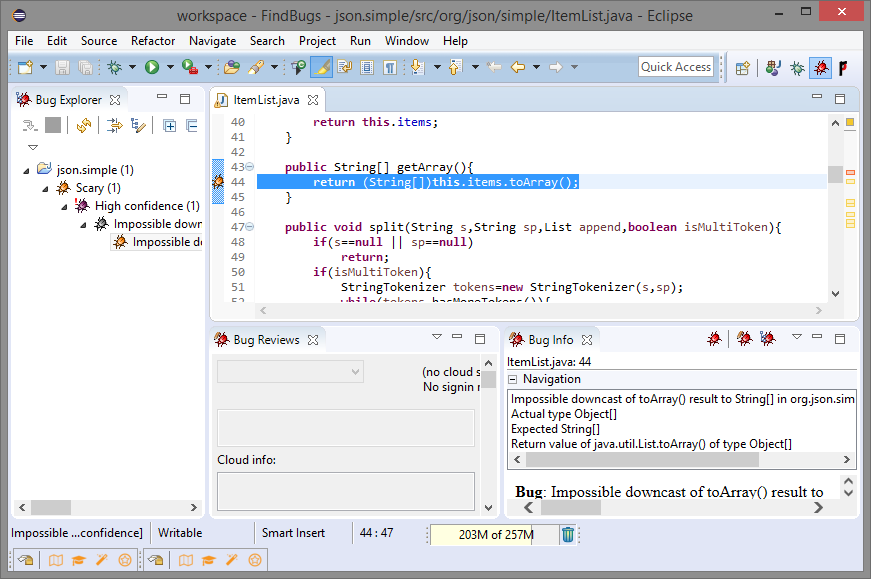
Figure 1: FindBugs perspective.
CHECK: create a screenshot showing the project structure with the number of bugs next to each file.
See: Bug Descriptions for a list of bugs that can be detected by FindBugs.
Configuring FindBugs
To configure FindBugs, right-click on the project and go to Properties / FindBugs (Figure 2). On the top of the window, project specific settings can be enabled. (These settings will be saved in a .settings file, which can be committed into version control systems and therefore, all developers will work with the same settings.) Set the minimum rank to report to 20. Did FindBugs find any additional errors?
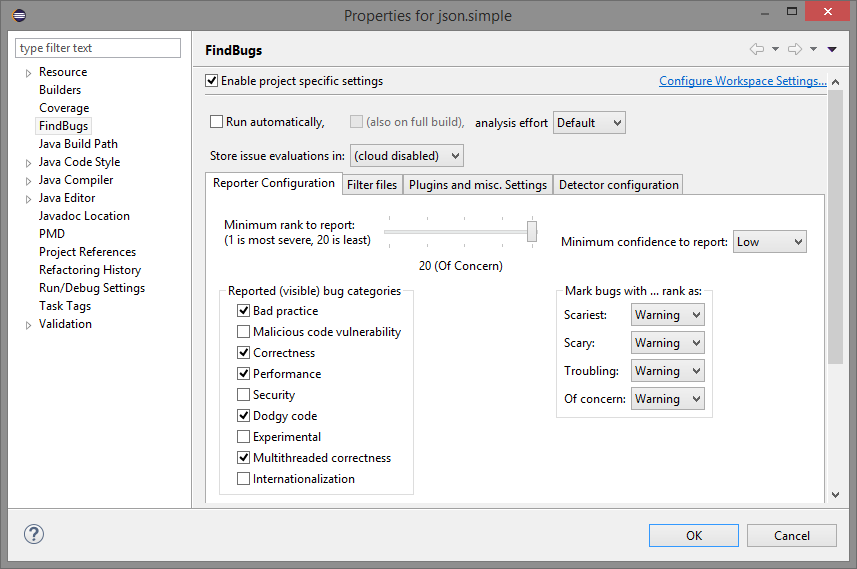
Figure 2: FindBugs configuration.
CHECK: create a screenshot showing the project structure with the number of bugs next to each file with the new configuration. Pick an interesting error and take a screenshot of that too.
The error markers can be removed from the files by right-clicking on the project and selecting Find Bugs / Clear Bug Markers.
SonarQube
SonarQube is a quality management platform incorporating several functions. It runs different scanners performing code analysis, a database to store results and a web dashboard to view the results.
See: SonarQube Architecture and Integration
Getting SonarQube
- Download SonarQube from here.
- Extract the downloaded archive file to some location.
Starting SonarQube
- Go to the folder where SonarQube is extracted and go under bin.
- Select the folder corresponding to your OS and inside that folder and run
./sonar.sh console(Linux / Mac) orStartSonar.bat(Win). - On Linux you can use the
uname -acommand to find out whether you are running a 32-bit or 64-bit kernel. - On Linux pay attention that the actual folder (.) is not in the path, therefore the command has to be prefixed with
./as above. - It takes time to start all three components of SonarQube Server (Compute engine, Search server, Web server), wait until you see all these three lines in the log:
jvm 1    | 2016.09.21 17:38:03 INFO  app[o.s.p.m.Monitor] Process[es] is up
...
jvm 1    | 2016.09.21 17:38:45 INFO  app[o.s.p.m.Monitor] Process[web] is up
...
jvm 1    | 2016.09.21 17:38:59 INFO  app[o.s.p.m.Monitor] Process[ce] is up
- Open http://localhost:9000/ in a browser to see the (currently empty) SonarQube dashboard.
- You can log in with the default admin / admin credential to configure settings (but we won't need it for the current exercises).
Running SonarQube from Maven
SonarQube analysis can be easily integrated into a Maven build.
- Open the pom.xml of the json.simple project and understand it contents. Use the Maven documentation to identify a setting you are not familiar with.
- Build the project and run its tests
mvn test
- For running a default SonarQube analysis there is no need to add anything to the pom.xml, just execute the
sonar:sonargoal.
mvn sonar:sonar
- Open http://localhost:9000/ in a browser to go to the SonarQube dashboard (Figure 3).
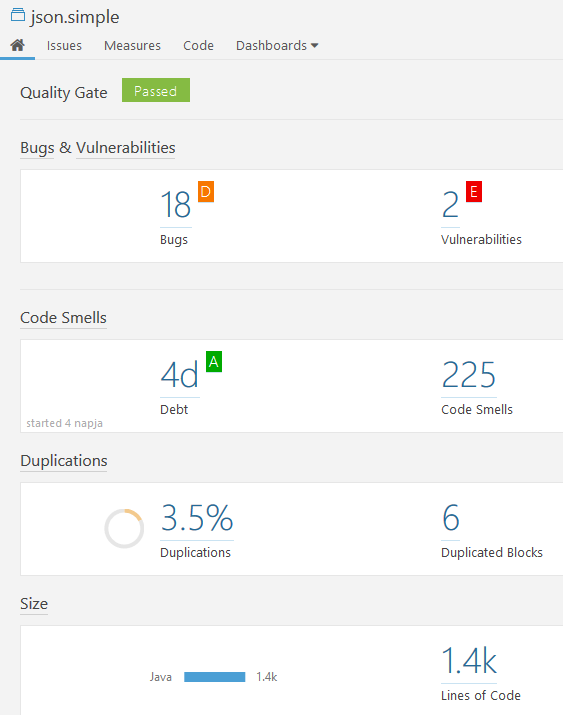
Figure 3: SonarQube dashboard.
Inspecting the results
Click on the name of the project and inspect the results.
- On the homepage of the project you can see a summary of the bugs, vulnerabilities, code smells and duplications. Clicking on the numbers take you to the details.
- On the Issues page you can see and filter the bugs, vulnerabilities and code smells.
- On the Measures page you can see different metrics about the project along with estimated efforts.
CHECK: Pick an interesting bug, vulnerability or code smell and take a screenshot.
The code analysis can be customized with additional parameters.
See: Analyzing with SonarQube Scanner for Maven and Analysis Parameters.